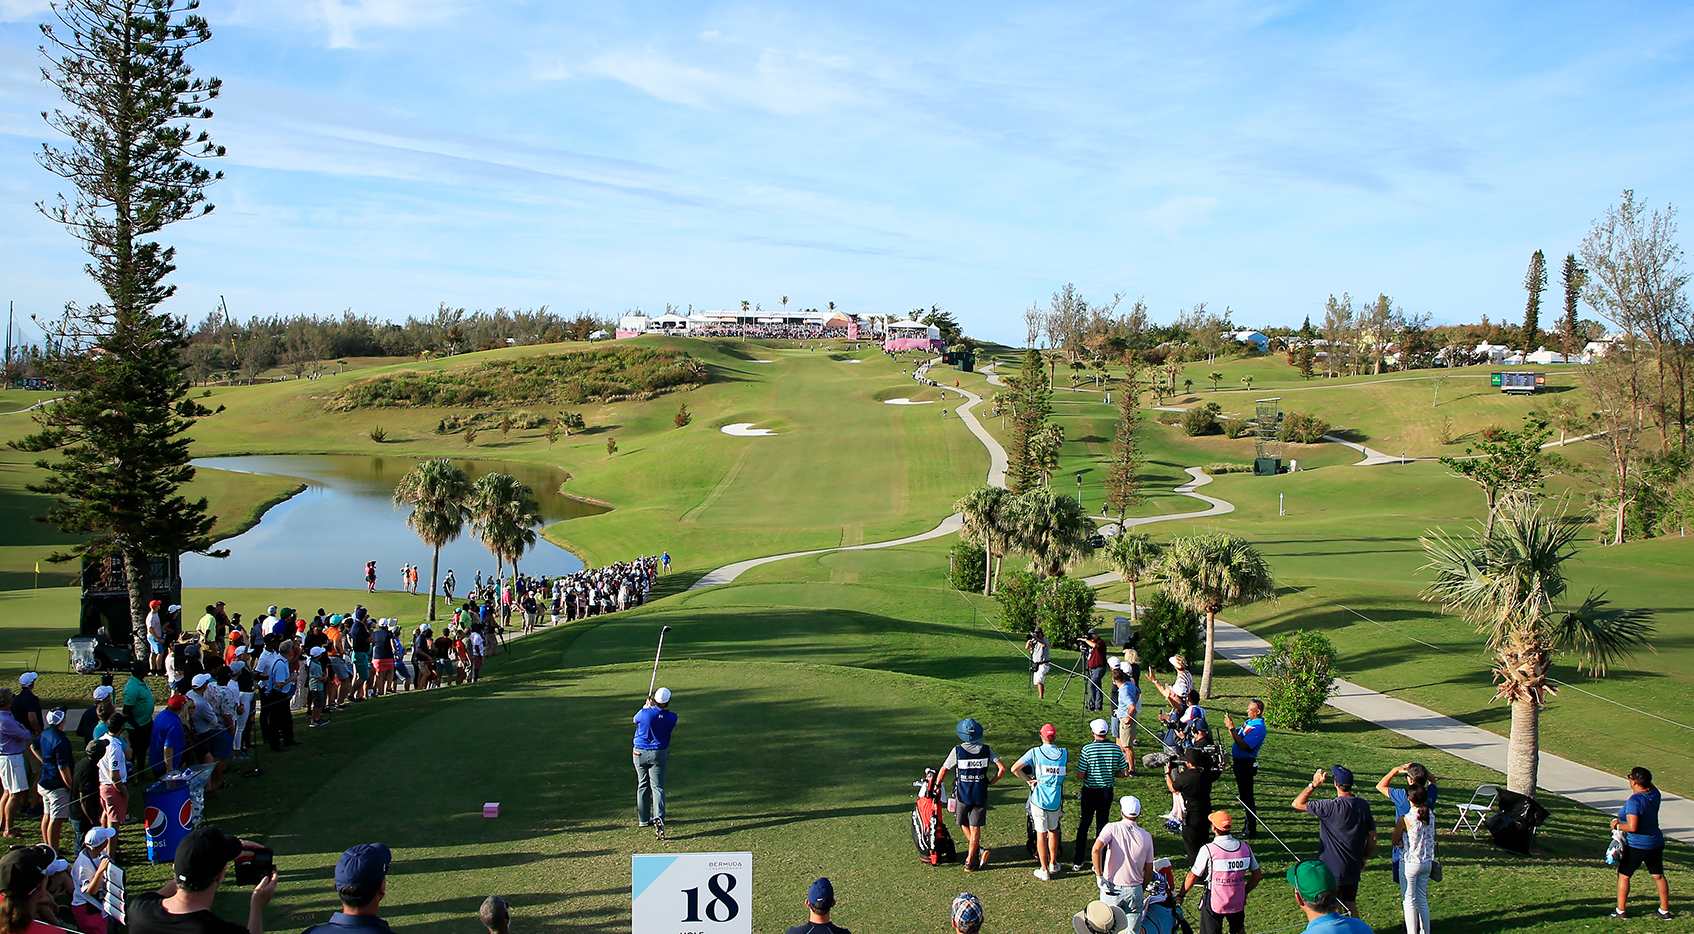
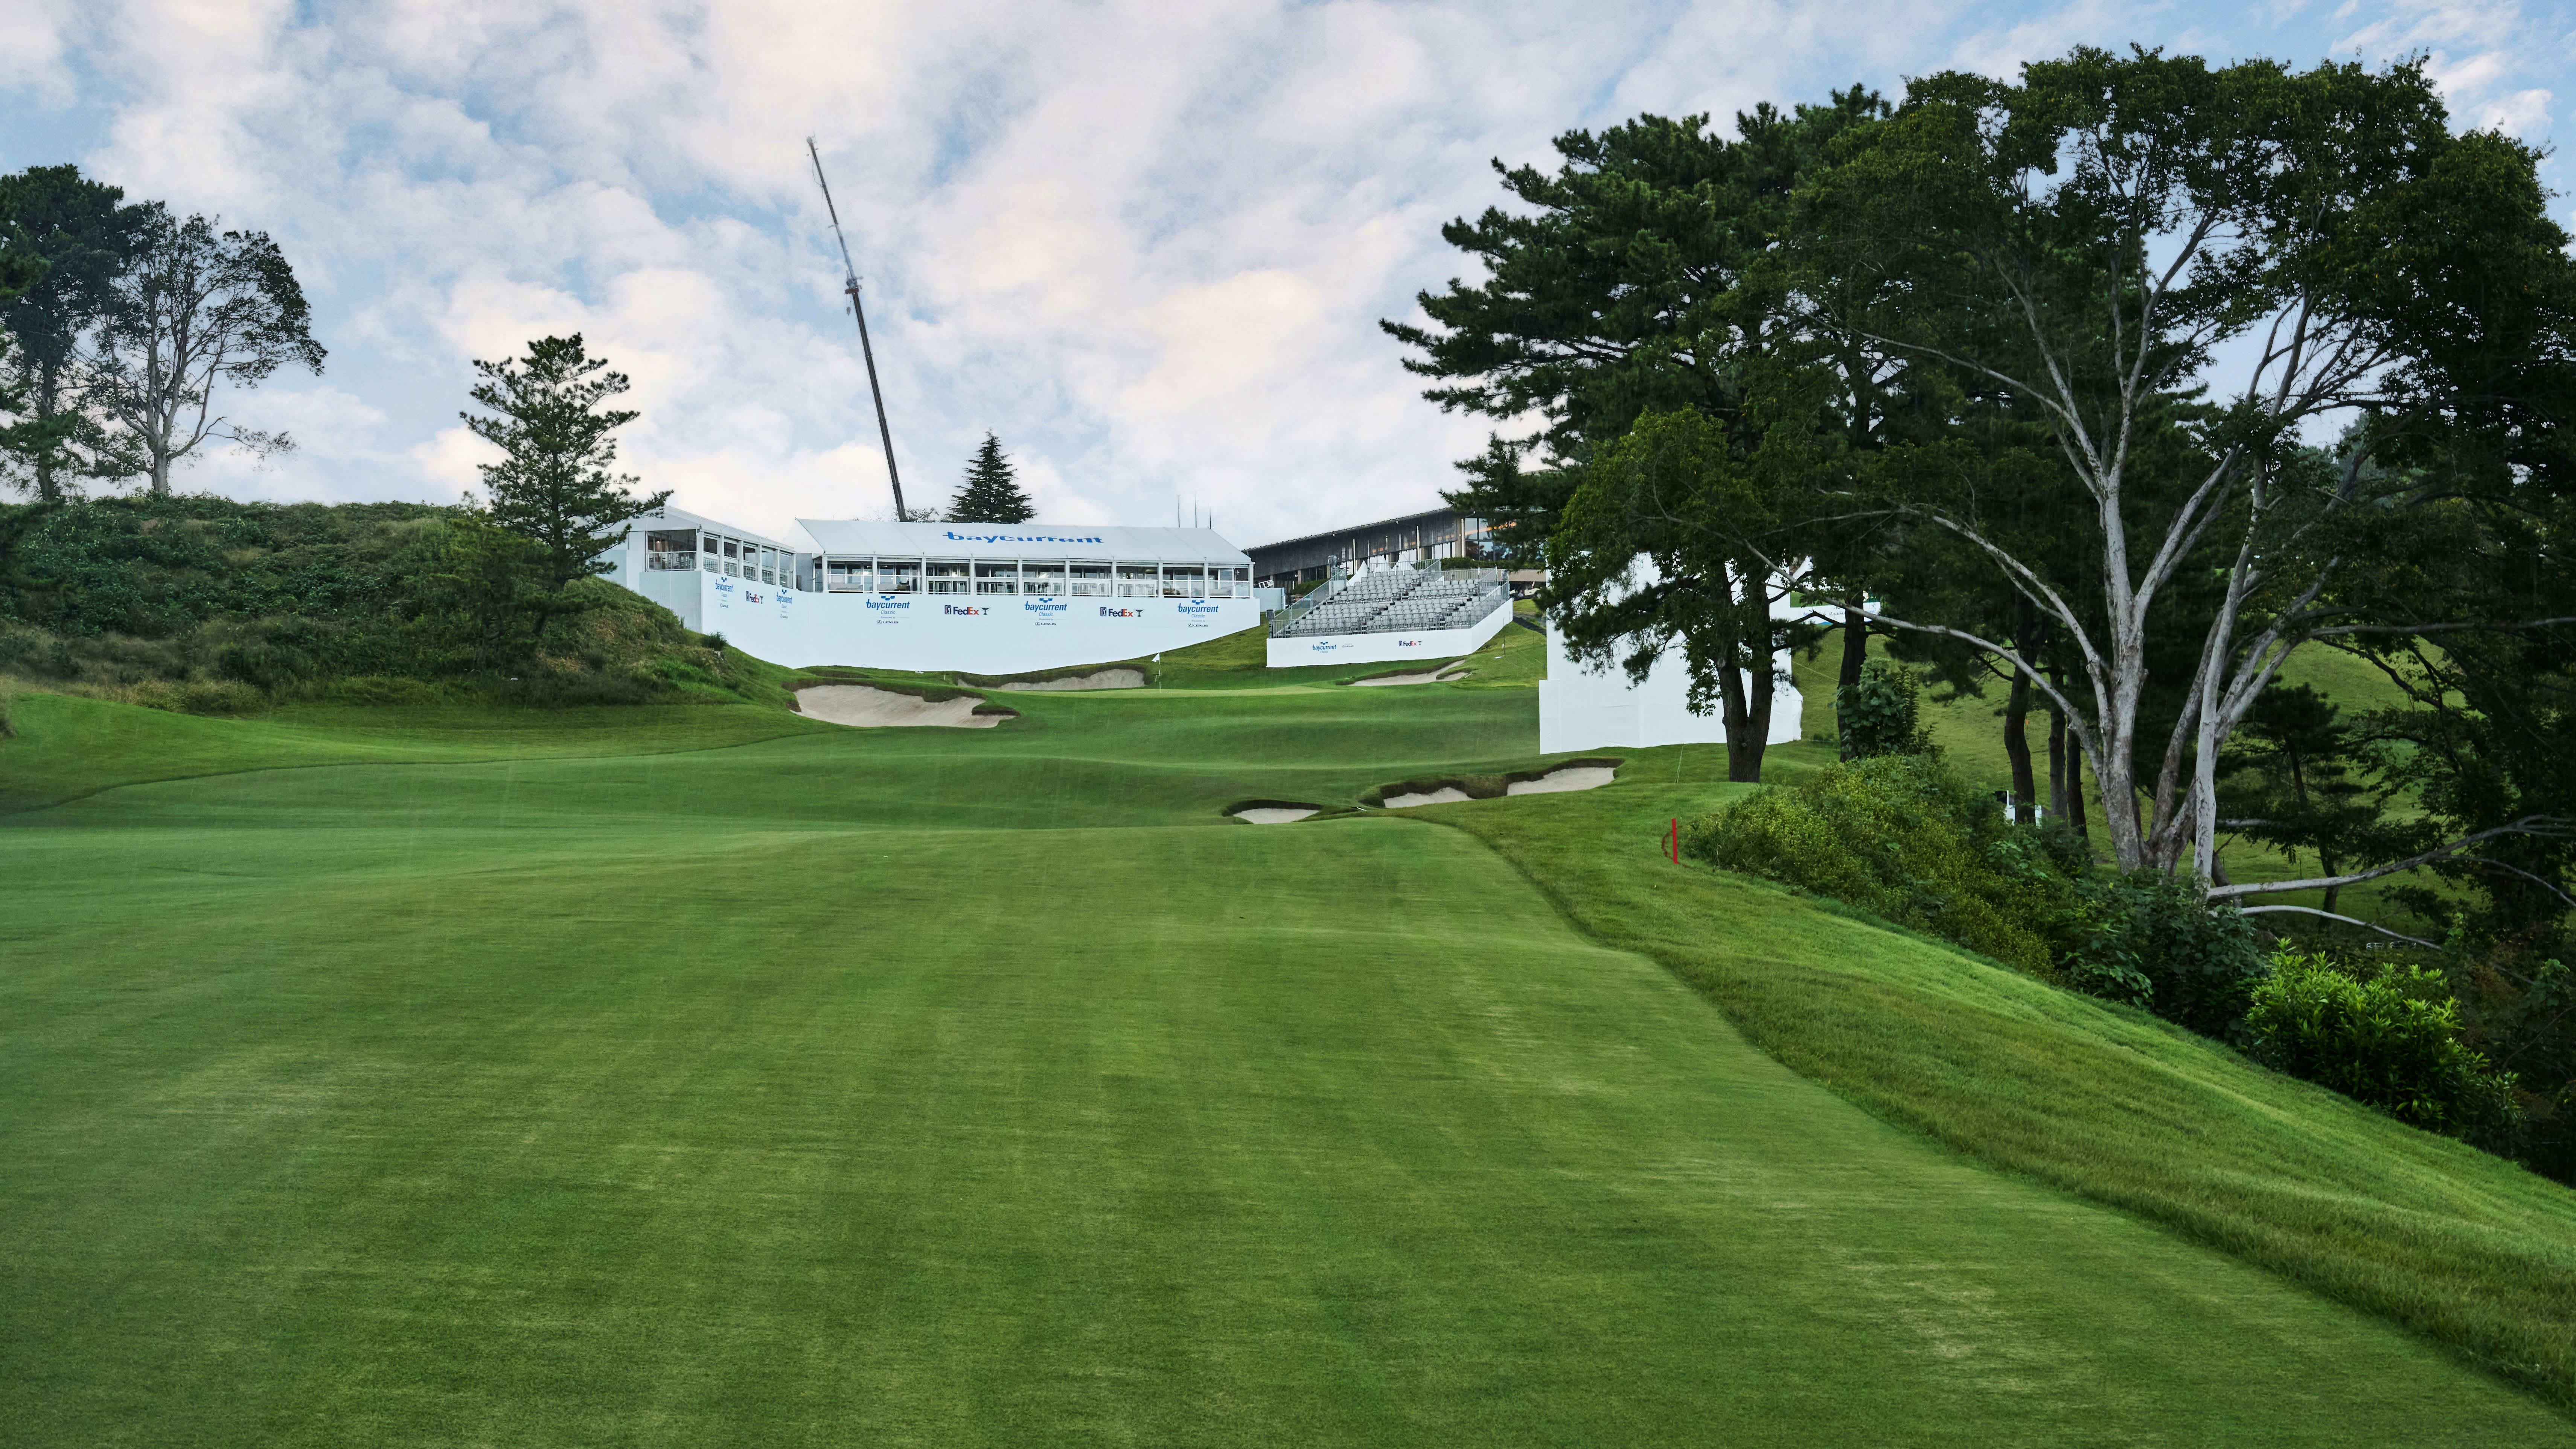
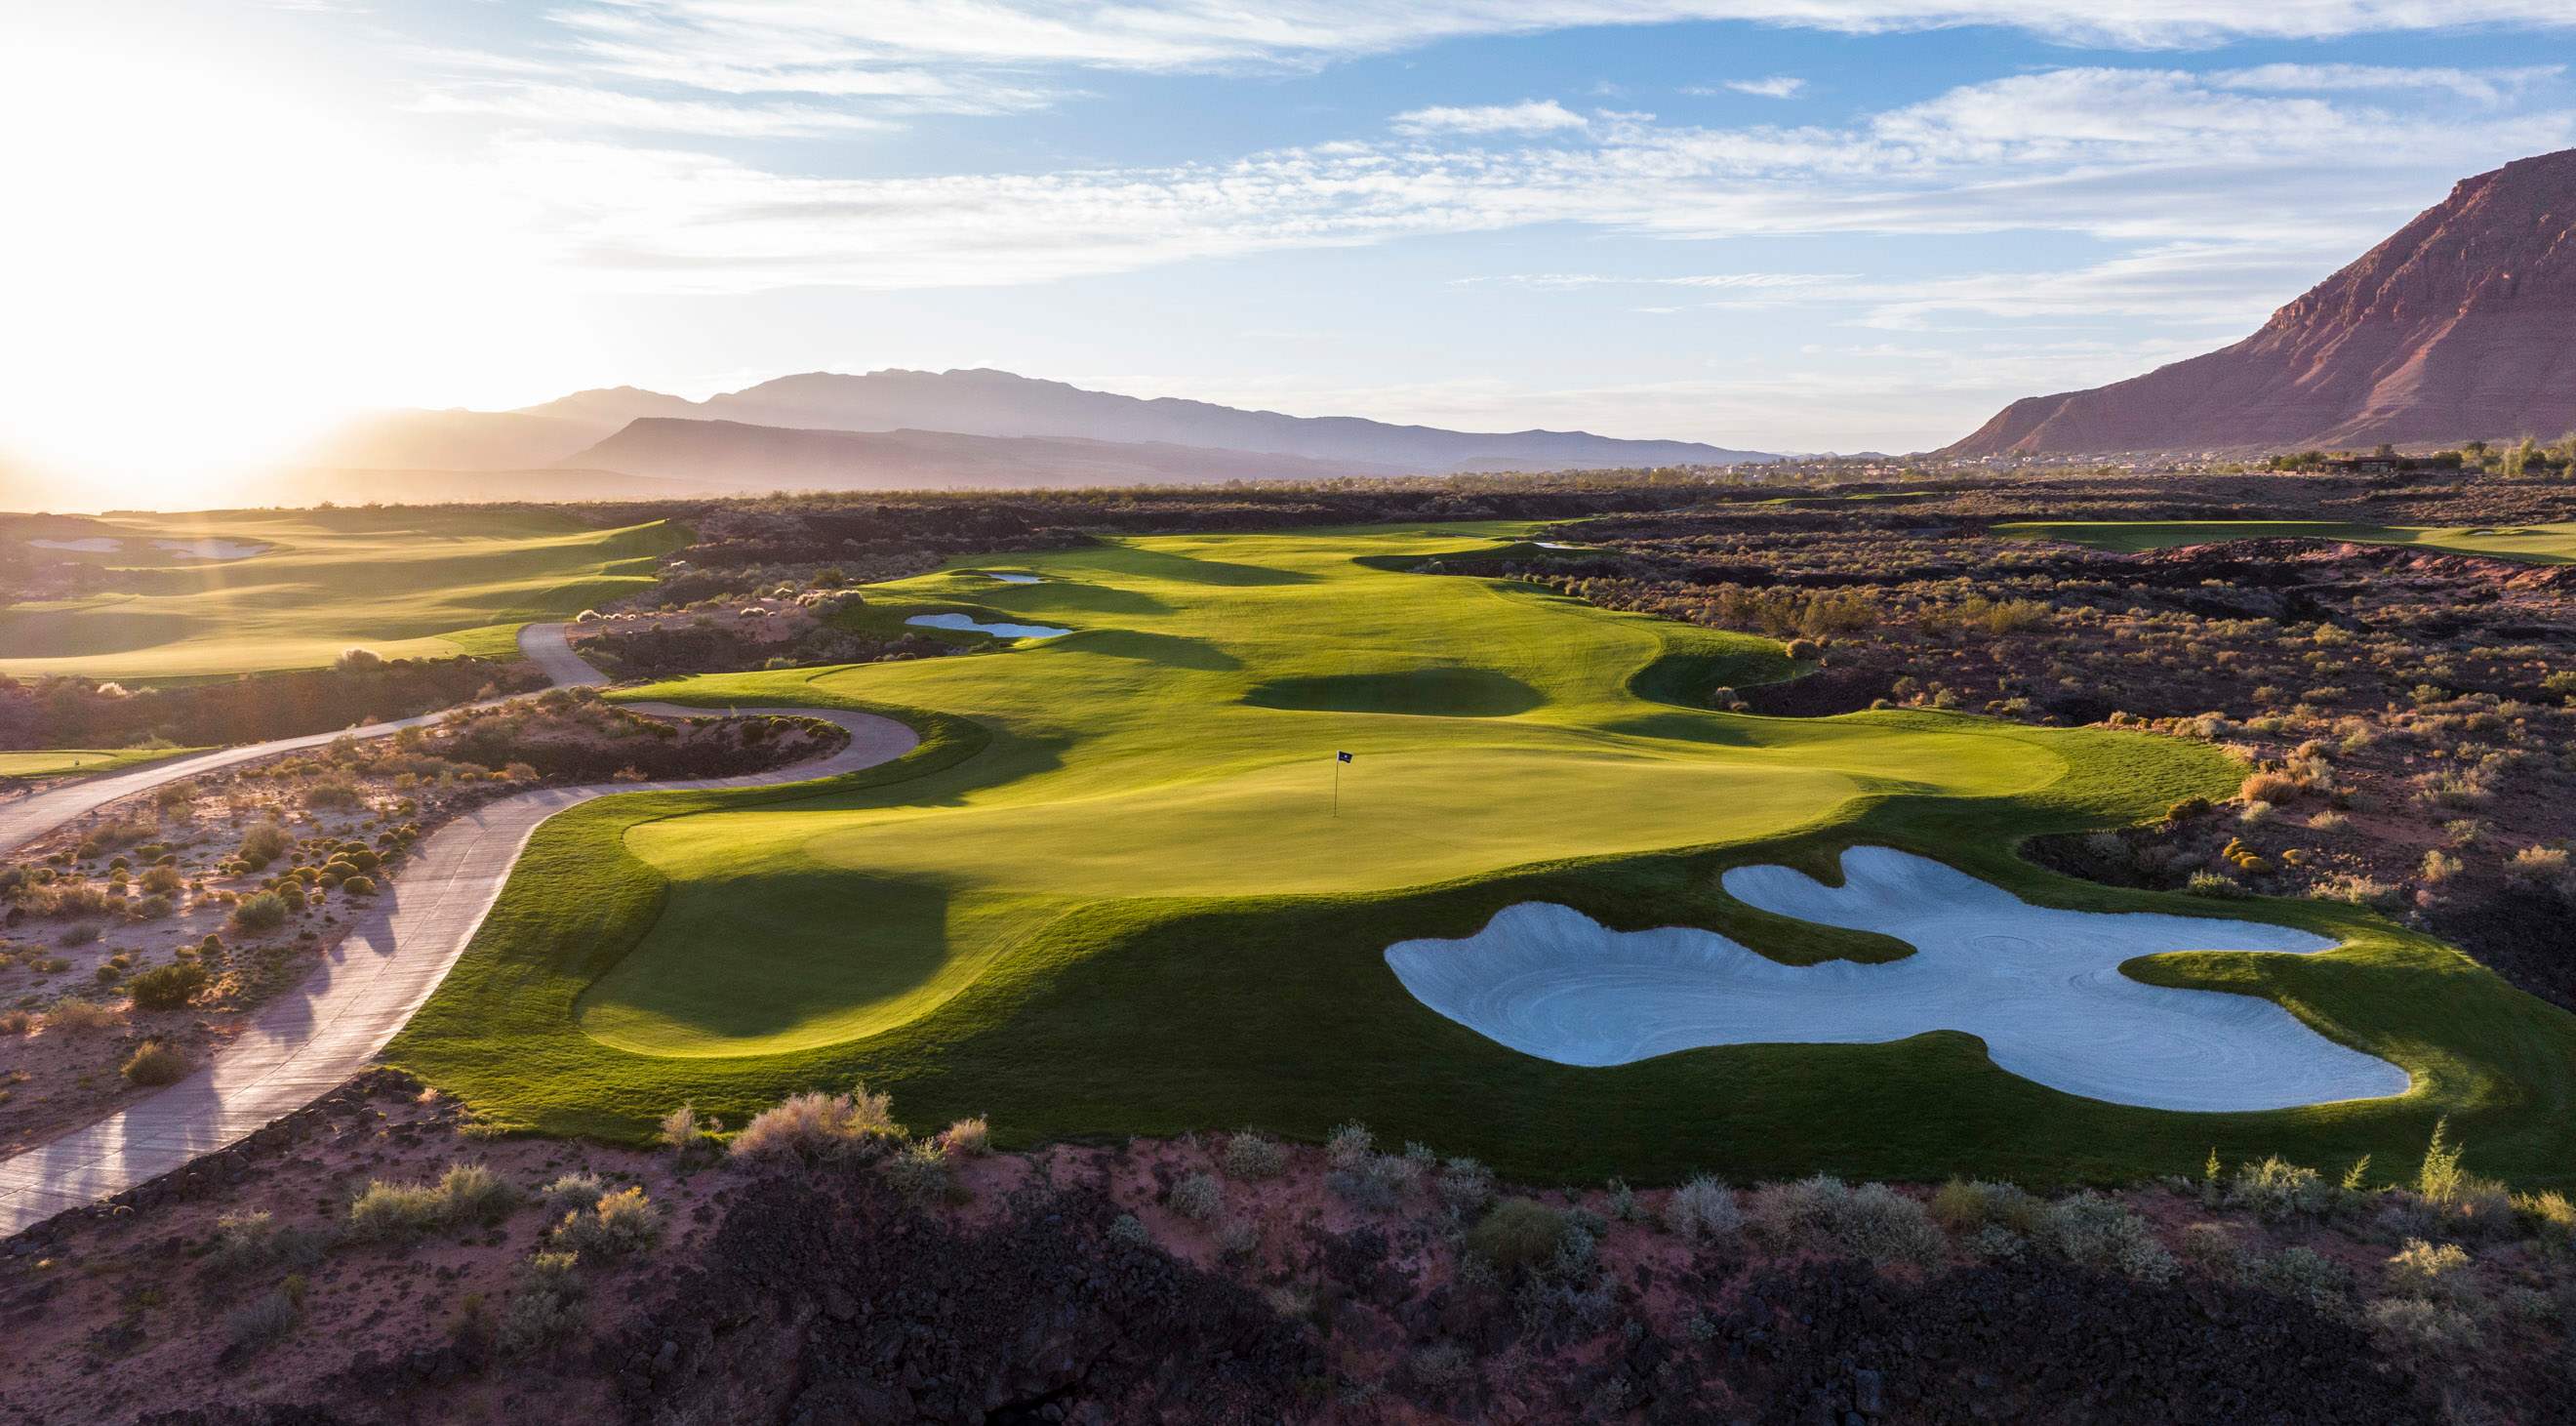
The Card
- Venue: Vidanta Vallarta
- Where: Vallarta, MEX
- Architect: Greg Norman
- Scorecard: Par 71, 7,337 yards
- Fairways: Paspalum
- Rough: Paspalum, 2.5 inches
- Greens: Paspalum, running 11.5 on the stimp
The VidantaWorld Mexico Open returns to Vidanta Vallarta on October 29, 2026 with 120 players in the field. The card has changed: this is a 7,337-yard par 71, where the version played from 2022 through 2025 measured 7,436 yards at the same par.
That matters for every number below. The difficulty profile and the skill correlations were all measured on the older setup, so treat them as a guide to the property rather than a readout of this week's test.
The read: Same resort, same paspalum, slightly different card, so lean on the historical profile for character and not for precision.
What Kind Of Test This Is
Across 2024 and 2025, Vidanta Vallarta sat around tour average on most of the broad difficulty measures: greens in regulation at 67.1%, scrambling at 55.3%, a bogey-or-worse rate of 16.8%, and putts made inside 10 feet at 88.0%. None of that describes a brute. The birdie-or-better rate of 22.7% ranked easier than average, which matches winning scores that have run deep into the teens and beyond.
The exception was approach proximity. At 47.4 feet it ranked 20th hardest of the 169 courses measured for it, one of the tougher marks on record, and the penalty for missing a green (0.77) ranked harder than average too. Driving accuracy at 65.4% and the penalty for missing a fairway (0.30) both ranked easier than average, so the tee shot was the forgiving part.
Worth repeating: only two runnings fell inside that 2024-2025 window, so these percentiles rest on a thin sample. The direction is clear enough, the exact rank less so.
The read: A scoreable week where the field separates on iron play rather than survival golf.
The Holes
Par 71 made up of five par 3s, nine par 4s and four par 5s, which is a heavy diet of one-shotters by tour standards. The par 3s average 198 yards and the par 5s average 593, while the par 4s average 441 and stretch from 297 to 496 yards. Only two of those par 4s sit in the standard 360 to 450 band, so the two-shot holes split toward the extremes.
On the older setup, the 460-yard 10th was the hardest hole on the course at 0.426 over par, with the 475-yard 16th next at 0.291 over and the 585-yard 8th playing 0.219 over, an unusual figure for a par 5. The giveaways ran the other way: the 170-yard 7th played 0.624 under par, the 455-yard 18th 0.524 under and the 496-yard 14th 0.401 under.
That spread is the shape of the week. A handful of holes hand out shots in bunches and a short back-nine stretch takes them straight back.
The read: Scores move fast in both directions here, which argues for upside over steadiness in tournament formats.
Where Strokes Are Won And Lost
The clearest signal in the brief is mid-to-long iron play. Proximity from 175 to 200 yards tracked scoring here at 0.201 against 0.091 tour-wide, a gap of +0.11, the largest positive in the set. Approach accuracy from closer range did not travel the same way: 150 to 175 yards came in at a gap of -0.104 and 125 to 150 yards at -0.098, both mattering less here than at a typical stop. Combine that with the 198-yard par 3 average and the picture is a course that asks its hardest questions with the longer irons.
Off the tee, the split is finding the short grass rather than passing it. Driving accuracy over the last eight weeks carried a gap of +0.088 while driving distance came in at -0.097, less predictive here than tour-wide. That is consistent with the measured profile, where the penalty for missing a fairway ranked easier than average but accuracy itself still correlated with good weeks.
The short game is the negative column, and it is a finding rather than an absence of data. Around-the-green strokes gained posted a gap of -0.129, scrambling -0.127, scrambling proximity -0.12 and rough proximity -0.117, every one of them tracking scoring less closely here than at an average event. Birdie-or-better rate (-0.095) and bogey-or-worse rate (-0.084) also mattered less than usual, which suggests the field's separation came from somewhere other than raw volume of red numbers.
One more positive worth noting: proximity from 50 to 75 yards showed a gap of +0.079, so the partial wedge did count. All of this is averaged over four runnings of roughly 92 to 117 players and measured on the earlier, longer setup, so hold it loosely.
The read: Prioritise long-iron proximity and recent fairway-finding, and discount short-game specialists who rely on scrambling to hold a score together.
Courses It Resembles
By measured profile rather than reputation, the closest match is The Landings Golf & Athletic Club - Deer Creek at 88.3% similar, followed by TPC Colorado at 86.6% and Nine Bridges at 85.5%. The Concession Golf Club (83.2%) and JCB Golf & Country Club (82.9%) round out the list.
The comparables all play to a higher par than Vidanta Vallarta, and the yardages range from Nine Bridges at 7,184 to TPC Colorado at 8,022, so this is not a list built on length. What they share with Vallarta is the balance of the test rather than the raw card.
The read: Course-history models built off these venues are worth a look, but adjust for the par 71 and the extra par 3.
What It Took To Win
Approach play carried three of the four champions here, with off the tee responsible for the other, and the winning totals have all been deep: Tony Finau at -24 in 2023, Brian Campbell at -20 in 2025, Jake Knapp at -19 in 2024 and Jon Rahm at -17 in 2022.
Knapp's 2024 week is the cleanest example, with 2.183 strokes gained on approach against -0.021 around the green. Campbell gained 1.461 on approach in 2025 and added 1.366 around the green, so the short game is not irrelevant, just rarely the lead. Rahm is the outlier, winning off 1.392 off the tee with 0.655 on approach in 2022.
Every champion also gained on the greens, from 0.456 up to 1.216, which is the quiet common thread. The skill gaps point away from scrambling and toward iron play, and the winners' numbers say the same thing from a different direction.
The read: Build around iron players in form who are not losing strokes with the putter, and accept that it will take something close to 20 under to collect.