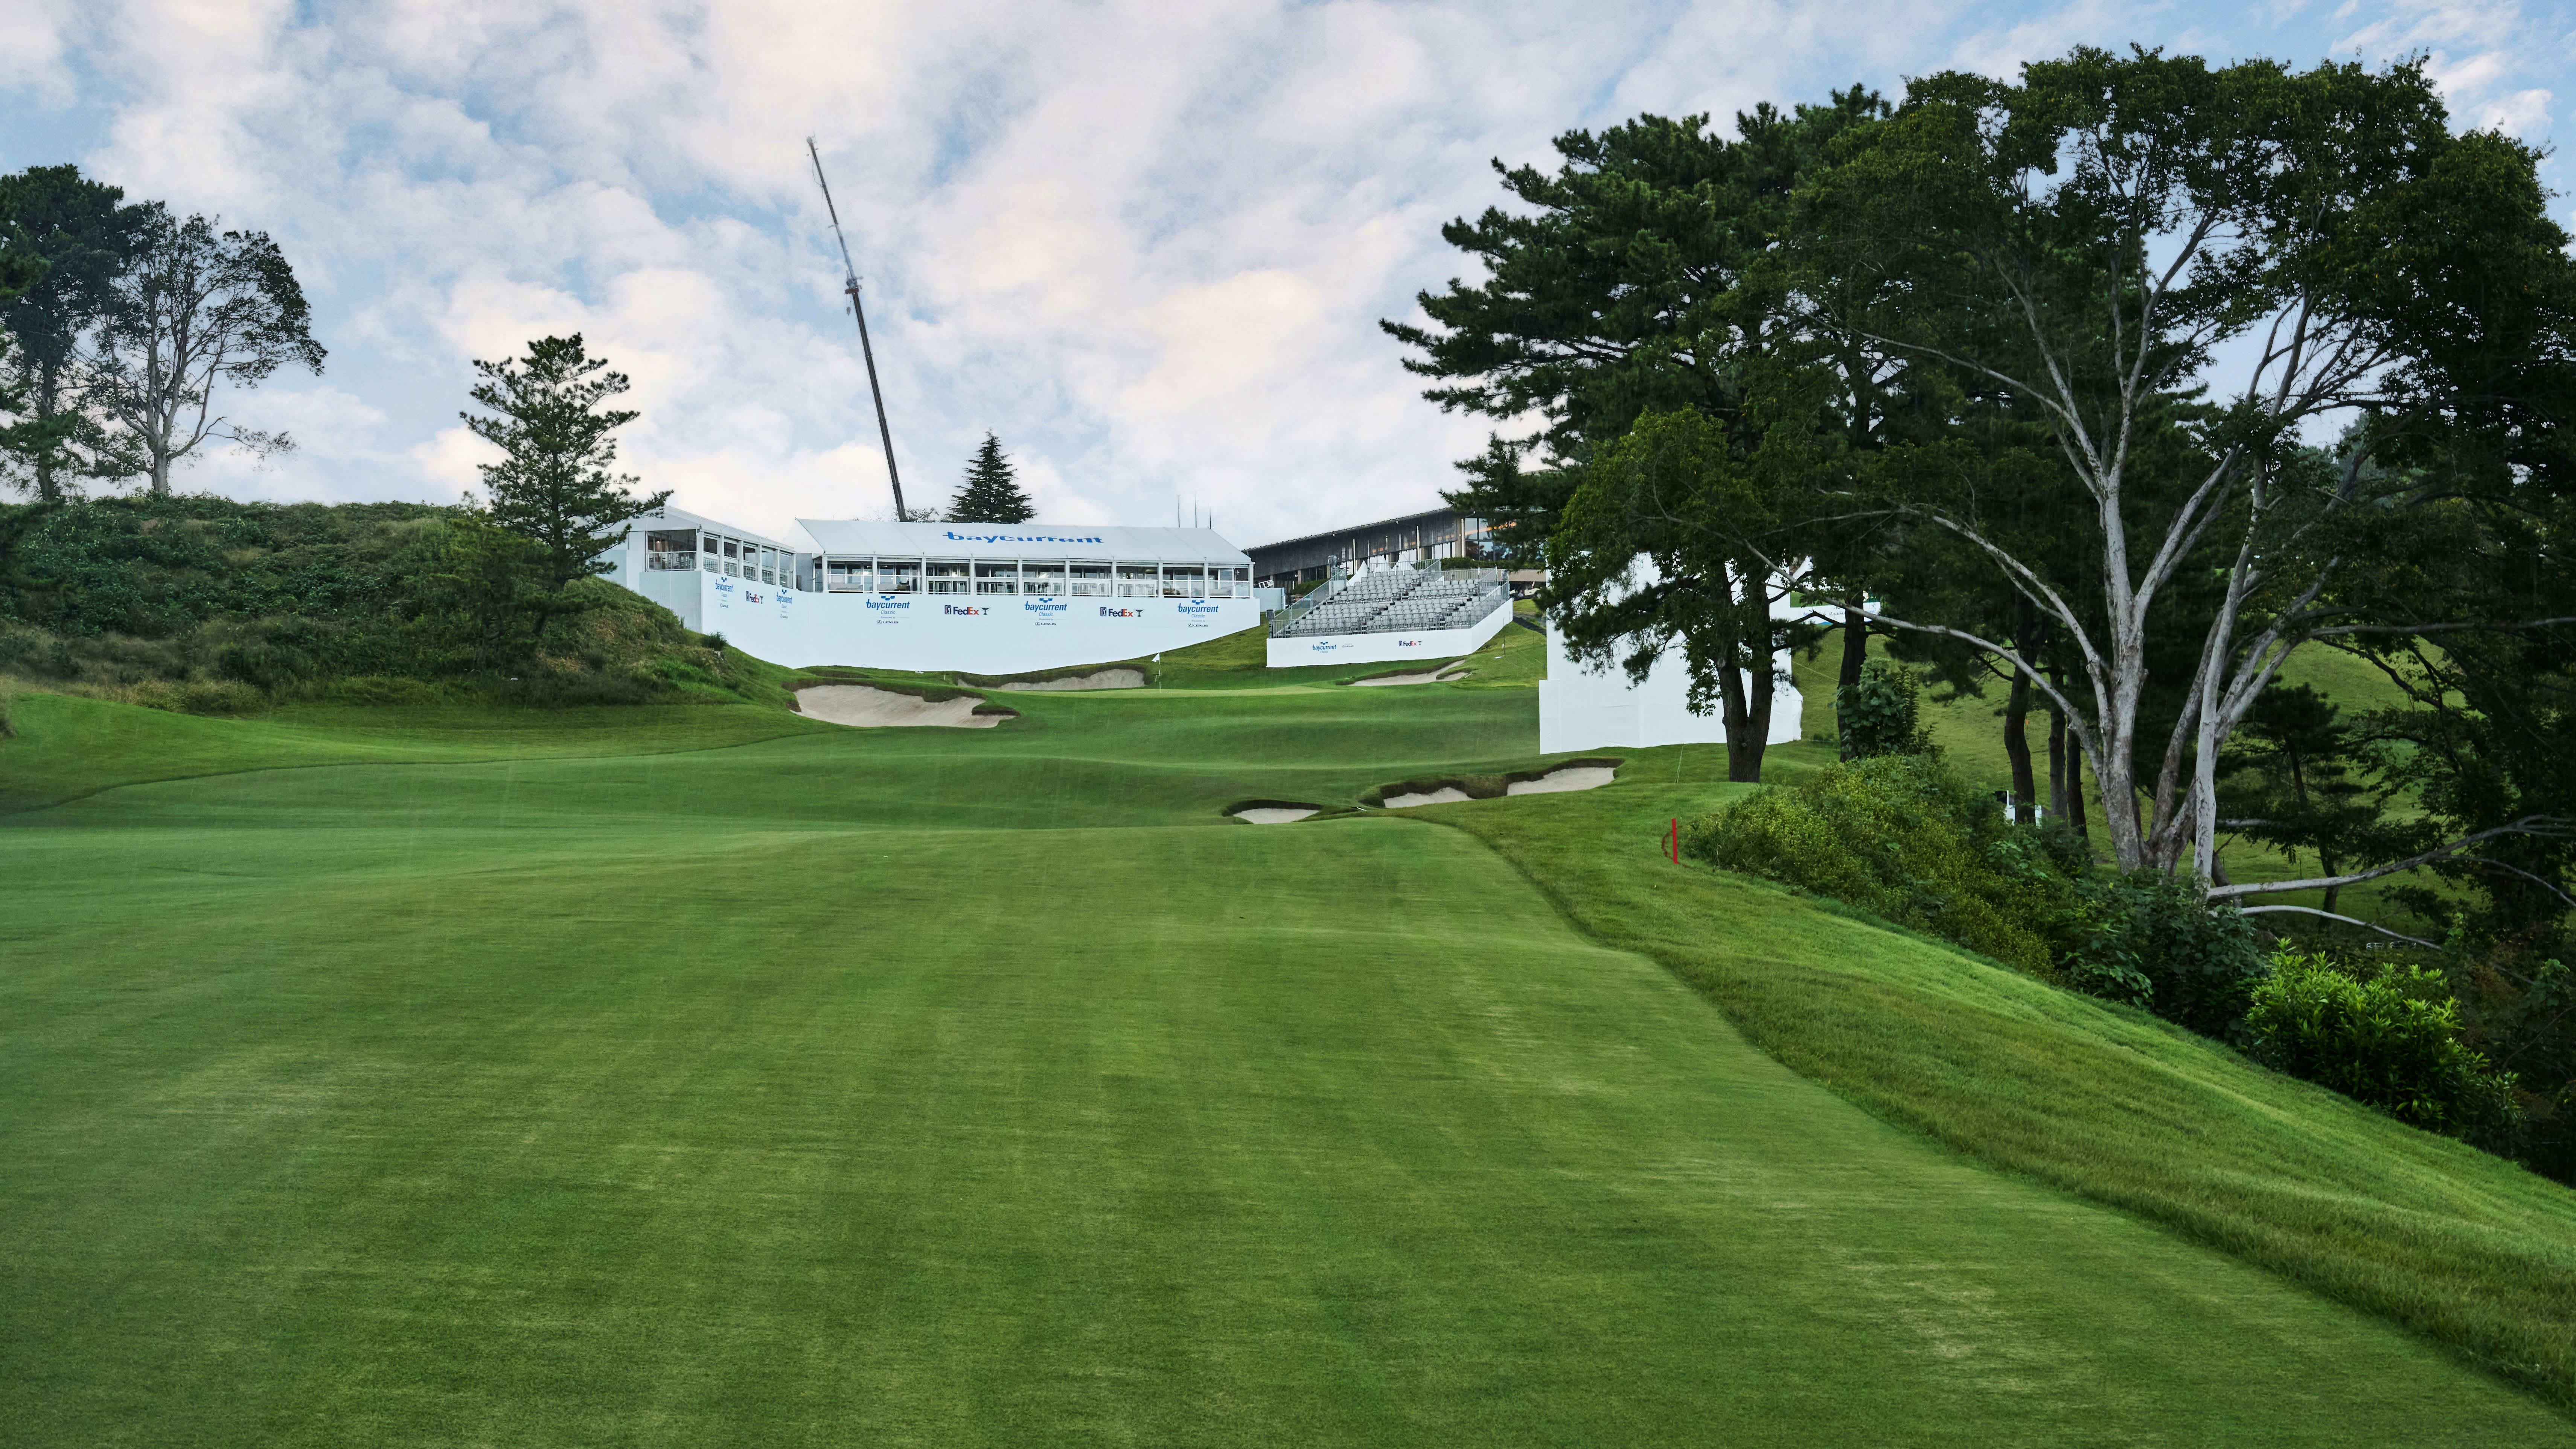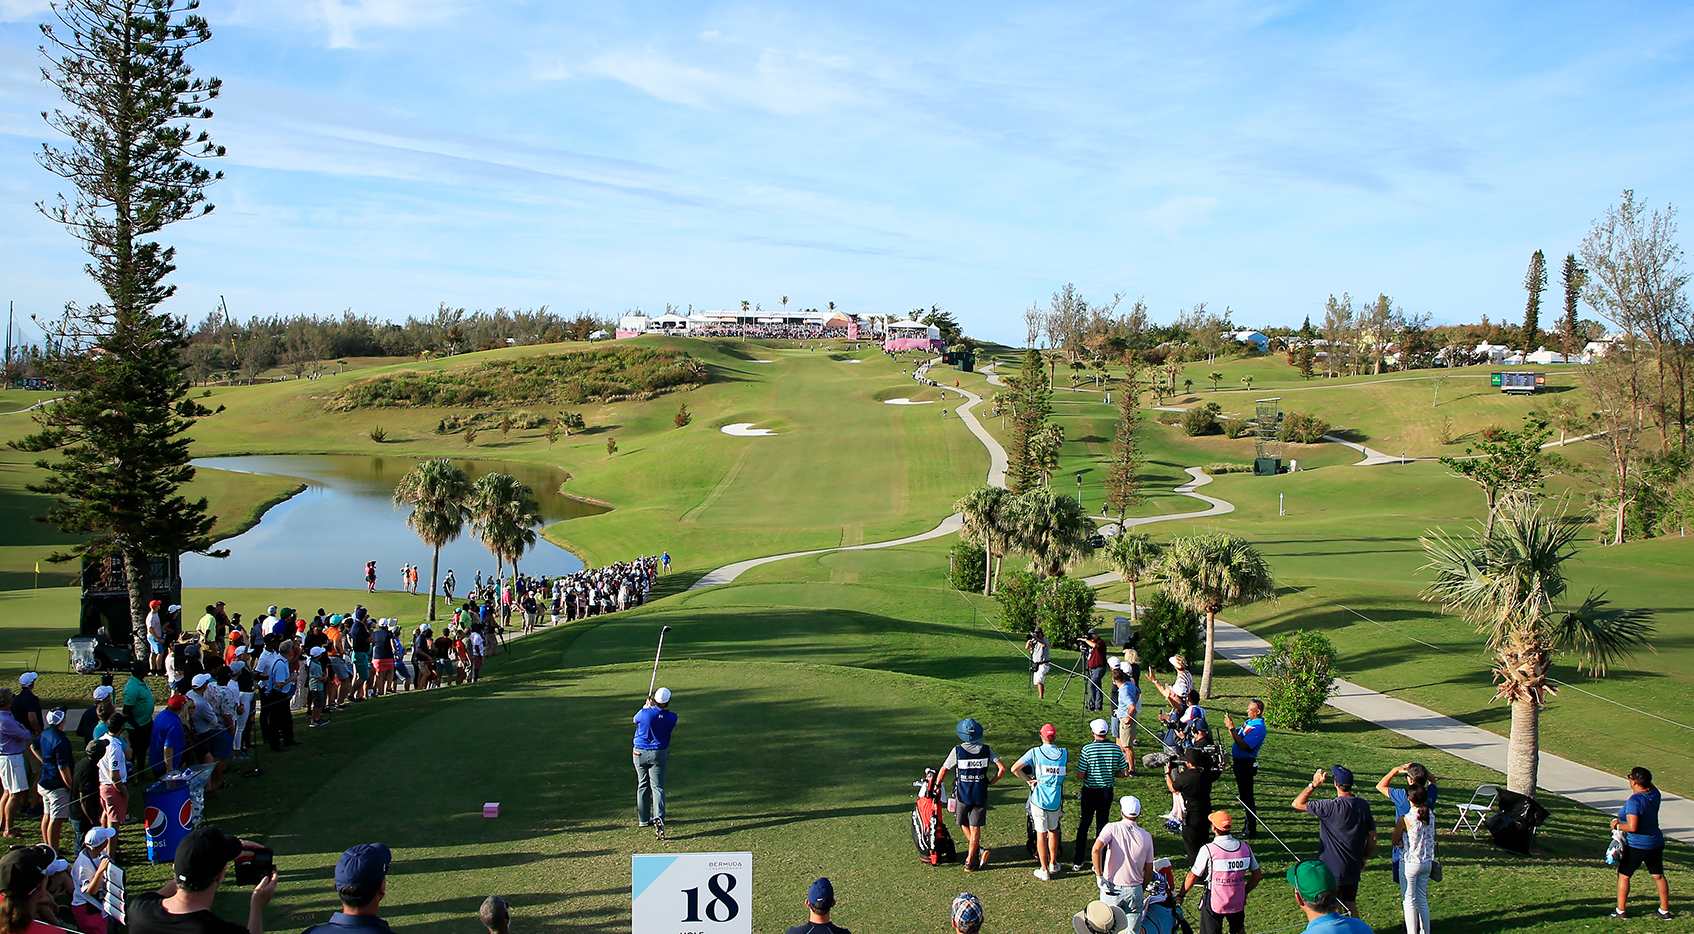
The Card
- Venue: Port Royal Golf Course
- Where: Southampton, BER
- Architect: Robert Trent Jones
- Scorecard: Par 71, 6,828 yards
- Fairways: Bermuda
- Rough: Bermuda, 2.5 inches
- Greens: Bermuda, running 10 on the stimp
The Butterfield Bermuda Championship returns on October 22, 2026 with a field of 120. At 6,828 yards to a par of 71, this is the shortest regular stop of the autumn on the PGA Tour, and the scorecard is only half the story: wind and firm Bermuda turf do more to set the number than yardage does.
The read: Treat the yardage as a floor, not a ceiling, and build around players who can control a golf ball in wind rather than those who overpower a card.
What Kind Of Test This Is
The headline figure is driving accuracy: fairways were found 50.9% of the time across 2024 and 2025, which ranks 26th hardest of the 194 courses measured for it. Greens in regulation sat at 63.9%, harder than average. On the surface that reads as a precision test, and the field's ball-striking numbers back that up.
The complication is what happens after a miss. The penalty for missing the fairway was 0.26 strokes, among the easiest on record at 179th of 192 courses, and the penalty for missing the green (0.76) sat around tour average. Scrambling at 56.5%, bogey-or-worse at 18.4% and birdie-or-better at 20.5% all landed in the middle of the pack. In other words, the course is hard to hit and soft to miss.
One caveat worth keeping in front of you: these percentiles are averaged over just two runnings inside the 2024-2025 window. A windy week and a calm week can move every one of those bars, so treat the profile as a sketch rather than a settled portrait.
The read: Low accuracy numbers with almost no cost to a miss argues against paying up for fairway-finders, and in favour of players who are comfortable scoring from the rough.
The Holes
The mix is 4 par 3s, 11 par 4s and 3 par 5s. The par 3s average 207 yards and carry the difficulty: holes 16 and 13 both measure 235 yards and played 0.264 and 0.213 over par respectively, with the 213-yard eighth at 0.173 over. Those three are where the field bled strokes.
The par 4s average 401 yards and run from 350 to 458, with 9 of them measuring between 360 and 450. That is a narrow band of mid-length two-shotters, which is why wedge and short-iron distance control keeps surfacing in the skills data below.
Scoring comes from the par 5s. The 517-yard seventh played 0.49 under par and the 507-yard 17th played 0.449 under, with the 553-yard second at 0.243 under. A closing reachable par 5 is worth noting for live betting as much as for lineup construction.
The read: Red figures here are made on the par 5s and protected on a brutal set of long par 3s, so long-iron quality matters less for gaining than for not losing.
Where Strokes Are Won And Lost
Start with the gaps, because those are the part of the data that is actually about Port Royal. The clearest positive is short-iron and wedge proximity. Proximity from 50-125 yards over the prior eight weeks tracked scoring at 0.155 here against 0.04 tour-wide, a gap of +0.115. Proximity from 100-125 yards over six months shows the same shape at +0.104. Given the band of mid-length par 4s, that fits.
Three-putt avoidance over 24 months carried a +0.083 gap, 0.176 here against 0.093 everywhere else. On Bermuda greens running 10, the finding is less about holing putts than about not giving one back from distance.
The negatives are the more interesting half of the brief. Off-the-tee strokes gained over the last eight weeks tracked scoring at 0.07 here against 0.183 tour-wide, a gap of -0.113, and adjusted driving distance came in at -0.095. Total tee-to-green at -0.097 and greens in regulation at -0.09 point the same way. The driver mattered less here than it does at a typical stop, which is consistent with a short par 71 where missing the fairway cost barely a quarter of a stroke.
The short game reads as a non-factor rather than a separator: around-the-green strokes gained posted a -0.085 gap, scrambling -0.098 and scrambling proximity -0.102. Long approach play was the same story, with proximity from 200-plus yards at -0.046 here against 0.043 tour-wide. Even full approach strokes gained ran a -0.073 gap, which does not mean irons are irrelevant, only that the specific wedge distances carried more weight here than the broader category did.
These are correlations across seven runnings of roughly 85 to 97 players, not causes, and the error bars on numbers built from that many weeks are not small. The direction is consistent enough across related statistics to take seriously.
The read: Prioritise wedge proximity and clean lag putting over driving distance and short-game rankings, which both tracked scoring less here than at an average week.
Courses It Resembles
By measured profile, the closest match is The Grange Golf Club at 92.7% similar, followed by Glen Abbey GC at 87.7%, The Woodcreek Club at 87.4%, The Renaissance Club at 86.6% and the South Course at Torrey Pines at 86.0%.
| Course | Similarity | Scorecard |
|---|---|---|
| The Grange Golf Club | 92.7% | Par 72, 7,112 yards |
| Glen Abbey GC | 87.7% | Par 72, 7,253 yards |
| The Woodcreek Club | 87.4% | Par 70, 7,032 yards |
| The Renaissance Club | 86.6% | Par 70, 7,282 yards |
| Torrey Pines (South) | 86.0% | Par 72, 7,765 yards |
Every one of those venues is longer than Port Royal, and Torrey Pines South is the better part of a thousand yards longer. The similarity is not about scale, then. It is about the shape of the test: courses where the fairway is hard to find and the field still finds a way to score, with The Renaissance Club in particular offering the seaside-wind parallel that reputation would also suggest.
The read: Form at The Renaissance Club and other exposed, accuracy-resistant venues is a fairer input here than form at other short courses.
What It Took To Win
Winning scores have been deep and volatile. Brendon Todd went to -24 in 2019 and Camilo Villegas matched it in 2023, while Adam Schenk took the 2025 title at -12, the highest winning number on record here. Rafael Campos won at -19 in 2024 and Seamus Power at the same figure in 2022, with Lucas Herbert and Brian Gay both getting there at -15.
The strokes gained splits for those winners are not recorded, so any claim about which part of their game carried the week would be a guess. What the scores themselves show is a 12-shot spread between the easiest and hardest winning totals, which is a wind signature more than a setup signature.
The read: Build for a wide range of outcomes: the winning number has moved enough week to week that a conservative target score is as defensible as an aggressive one.