
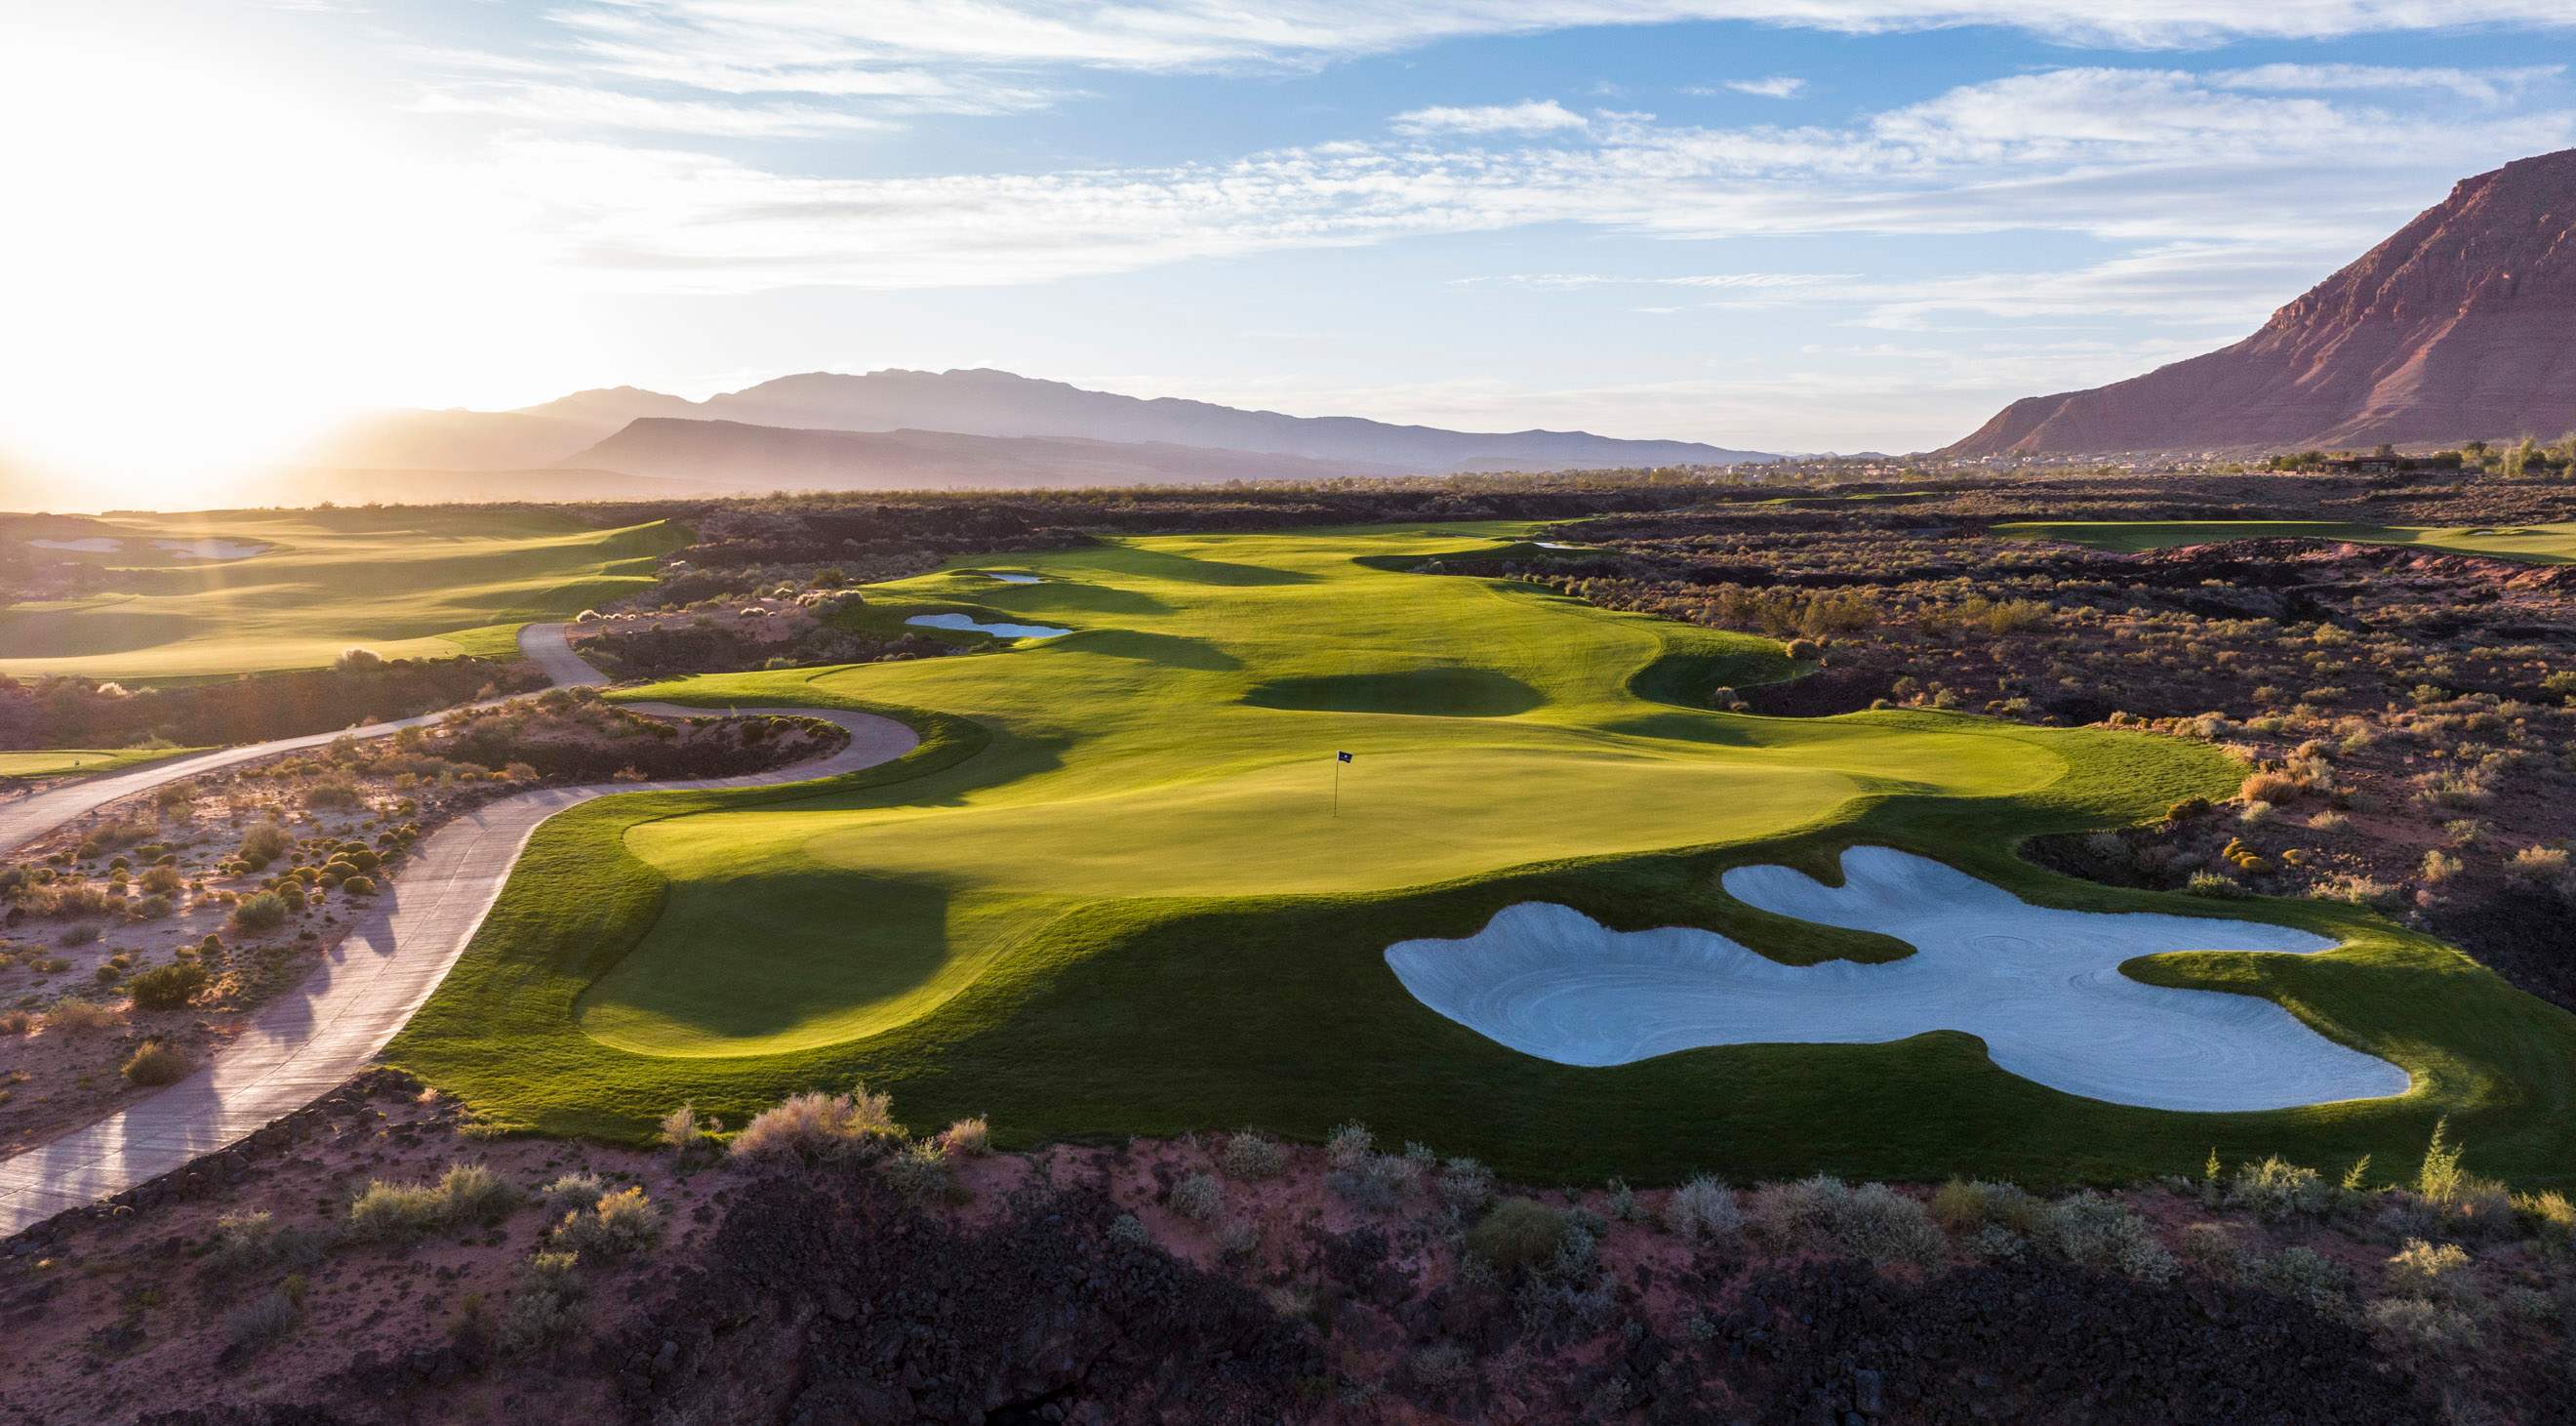
The Card
- Venue: Black Desert Resort
- Where: Ivins, Utah, USA
- Architect: Tom Weiskopf
- Scorecard: Par 71, 7,421 yards
- Fairways: Bentgrass
- Rough: 3.5 inches
- Greens: Bentgrass, running 12 on the stimp
The read: A 7,421-yard par 71 on bentgrass at 12 on the stimp is a full-length test, and the scorecard alone tells you the par 4s will decide it.
What Kind Of Test This Is
The profile from the 2024 and 2025 editions is unusual: this is one of the easiest courses on record to keep in play, and one of the most expensive to miss. Driving accuracy came in at 81.4%, ranking 193rd hardest of 194 courses measured, and greens in regulation at 73.7%, 174th of 192. Fields found fairways and greens at a high rate.
The punishment sat on the other side of that ledger. Missing the fairway cost 0.58 shots, third hardest of 192 venues, and missing the green cost 0.91, fourth hardest of 192. Putts made from outside 10 feet fell to 12.9%, tenth hardest of 168 courses, so the long-range conversions that rescue a week elsewhere were not there.
Net it out and the scoring extremes cancel: bogey-or-worse rate of 16.2% sits around tour average (111th of 192) while birdie-or-better rate of 24.6% is easier than average (163rd of 192). The caveat matters here. Two runnings is a thin sample, and these percentiles should be read as a sketch rather than a settled identity.
The read: Accuracy is cheap here and recovery is expensive, so favour players whose misses stay small rather than those who rely on scrambling to paper over bad ball-striking.
The Holes
The mix is 4 par 3s, 11 par 4s and 3 par 5s. Par 4s stretch from 320 to 532 yards, with only 3 of them measuring between 360 and 450 yards, which means the two-shot holes cluster at the ends of the range rather than in the middle. Average par 3 is 175 yards, average par 4 is 449, average par 5 is 590.
The difficulty is concentrated in the long par 4s on the closing stretch. Hole 11 at 532 yards played 0.246 over par, hole 13 at 519 yards played 0.172 over, and hole 16 at 506 yards played 0.103 over. Those are par 4s that function like short par 5s without the extra shot.
Scoring came back the other way in obvious places. The 595-yard 18th played 0.586 under par, the 322-yard 14th played 0.559 under, and the 589-yard 7th played 0.427 under. A round can be made and lost inside a four-hole window.
The read: The par 5s and the drivable 14th are near-mandatory birdie chances, so the separation comes from who survives 11, 13 and 16 at level par.
Where Strokes Are Won And Lost
Off the tee is where the venue leaned hardest on a specific skill. Adjusted off-the-tee strokes gained over the prior six months tracked scoring at 0.314 here against 0.21 tour-wide, a gap of +0.104 across two runnings of roughly 112 players. Penalty for lack of distance also registered above average at 0.21, 39th hardest of 160 courses, which fits a card with 500-yard-plus par 4s.
On approach, the gaps point at one specific band. Proximity from 50 to 75 yards, measured on eight-week form, tracked scoring at 0.16 here against essentially nothing tour-wide, a gap of +0.163, and the wider 50 to 125 yard window came in at +0.115. Longer-iron proximity worked too: overall proximity to hole on six-month form gapped +0.102. What did not travel was the middle wedge range, with 75 to 100 yards at -0.134 and 100 to 125 yards at -0.153.
Around the green, the finding runs against what the raw difficulty numbers imply. Missing the green cost 0.91 shots and scrambling held at 51.3% (34th hardest of 192), yet short-game form barely separated the field: adjusted around-the-green gained gapped -0.118 and scrambling form gapped -0.114. The reading that fits both is that the misses here are hard enough that good scramblers lose the edge they normally hold.
Putting looks the same way. Adjusted putts gained gapped -0.131, putting from 5 to 10 feet -0.126, and three-putt avoidance -0.116, even though putts made outside 10 feet ranked tenth hardest on tour. Bogey-or-worse form also mattered less than usual at -0.138. All of these rest on two runnings, so treat them as leans rather than laws.
The read: Build around driving and the 50 to 125 yard wedge game, and discount short-game and putting form more than the surface difficulty numbers would suggest.
Courses It Resembles
| Course | Similarity | Card |
|---|---|---|
| El Cardonal at Diamante | 93.8% | Par 72, 7,452 yards |
| TPC Summerlin | 82.5% | Par 71, 7,255 yards |
| Sedgefield Country Club | 82.2% | Par 70, 7,131 yards |
| Trinity Forest Golf Club | 80.9% | Par 71, 7,380 yards |
| The Landings Golf & Athletic Club - Deer Creek | 79.5% | Par 72, 7,185 yards |
El Cardonal at 93.8% is the standout match, and the resemblance is more than a number: another desert-corridor resort layout at similar length. The rest of the group skews toward lower pars and shorter yardages than Black Desert, which is worth holding in mind when leaning on form from those weeks.
The read: El Cardonal form is the most transferable comp on the list, with TPC Summerlin next, and course-fit models built on those two deserve weight.
What It Took To Win
Both winning scores were deep. Michael Brennan went -22 in 2025 and Matt McCarty -23 in 2024, so the number to beat has been set in the low twenties under par both times out.
The routes were not identical. Brennan's strongest area was off the tee at 1.904 strokes gained, with 0.521 on approach and 1.348 putting. McCarty's strongest area was putting at 1.645, supported by 0.926 off the tee, 0.556 on approach and 0.655 around the green. The summary splits evenly: off the tee 1, putting 1.
The common thread is that both champions putted well above the field even though putting form showed a negative gap for the wider field. That is the honest tension in this brief: the skill that has not predicted good weeks here has still shown up in the winner's card twice. With two data points, neither pattern is settled.
The read: Target elite drivers with live wedges and accept that a hot week on the greens is what turns a top ten into the trophy.