The Card
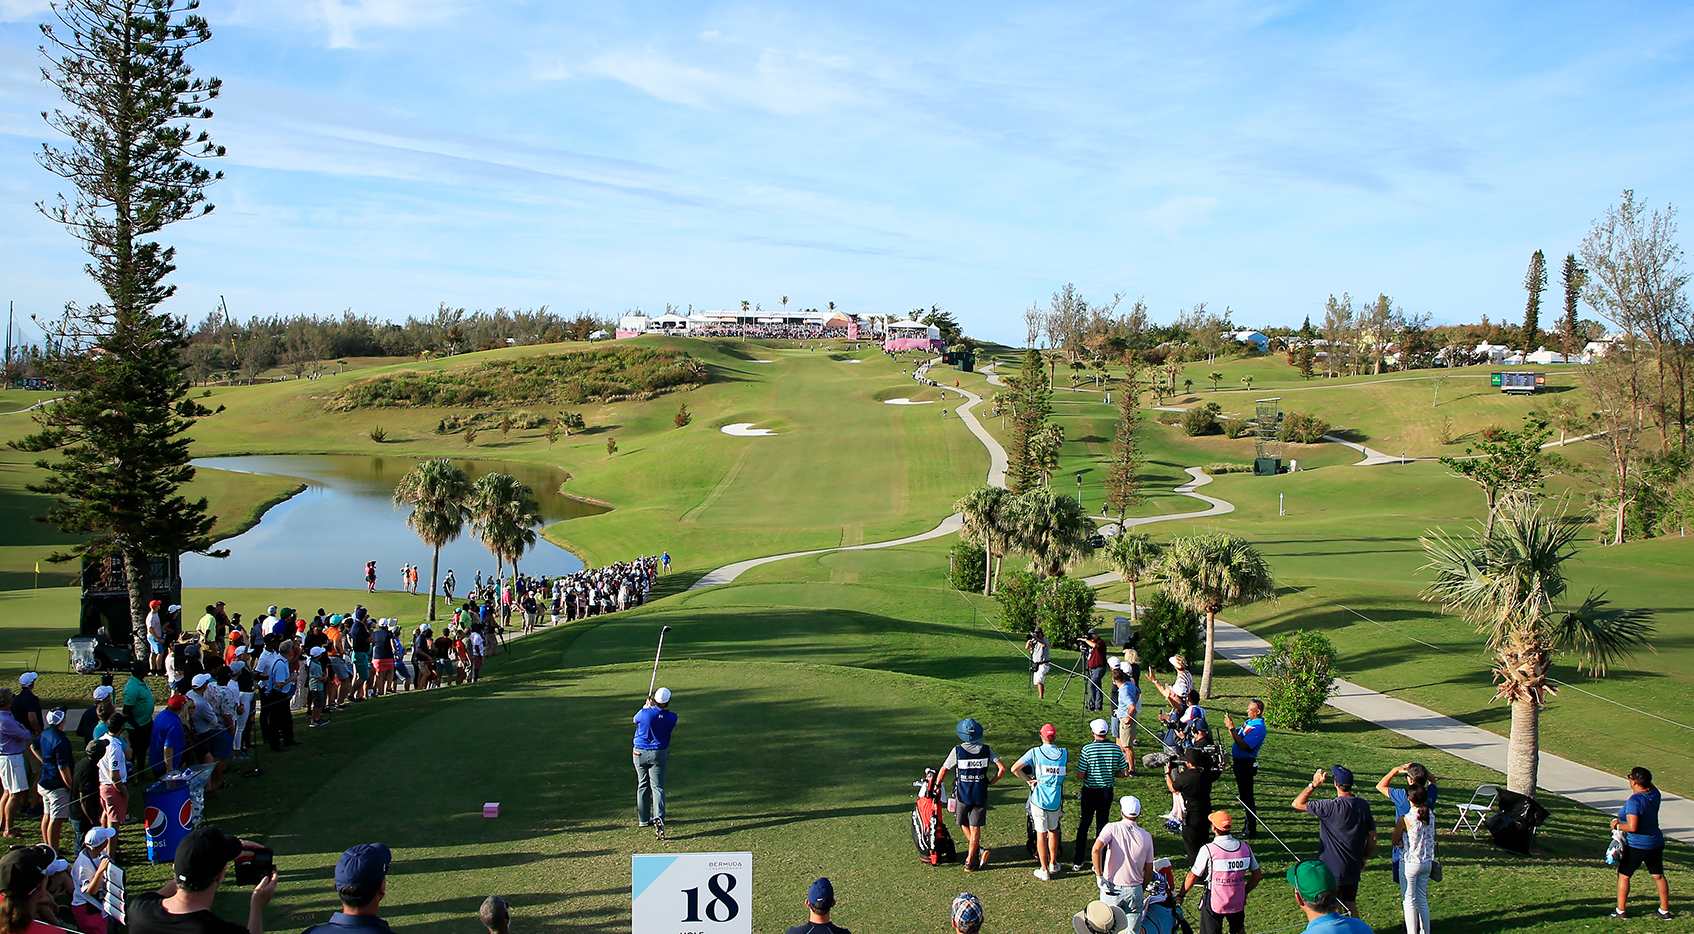
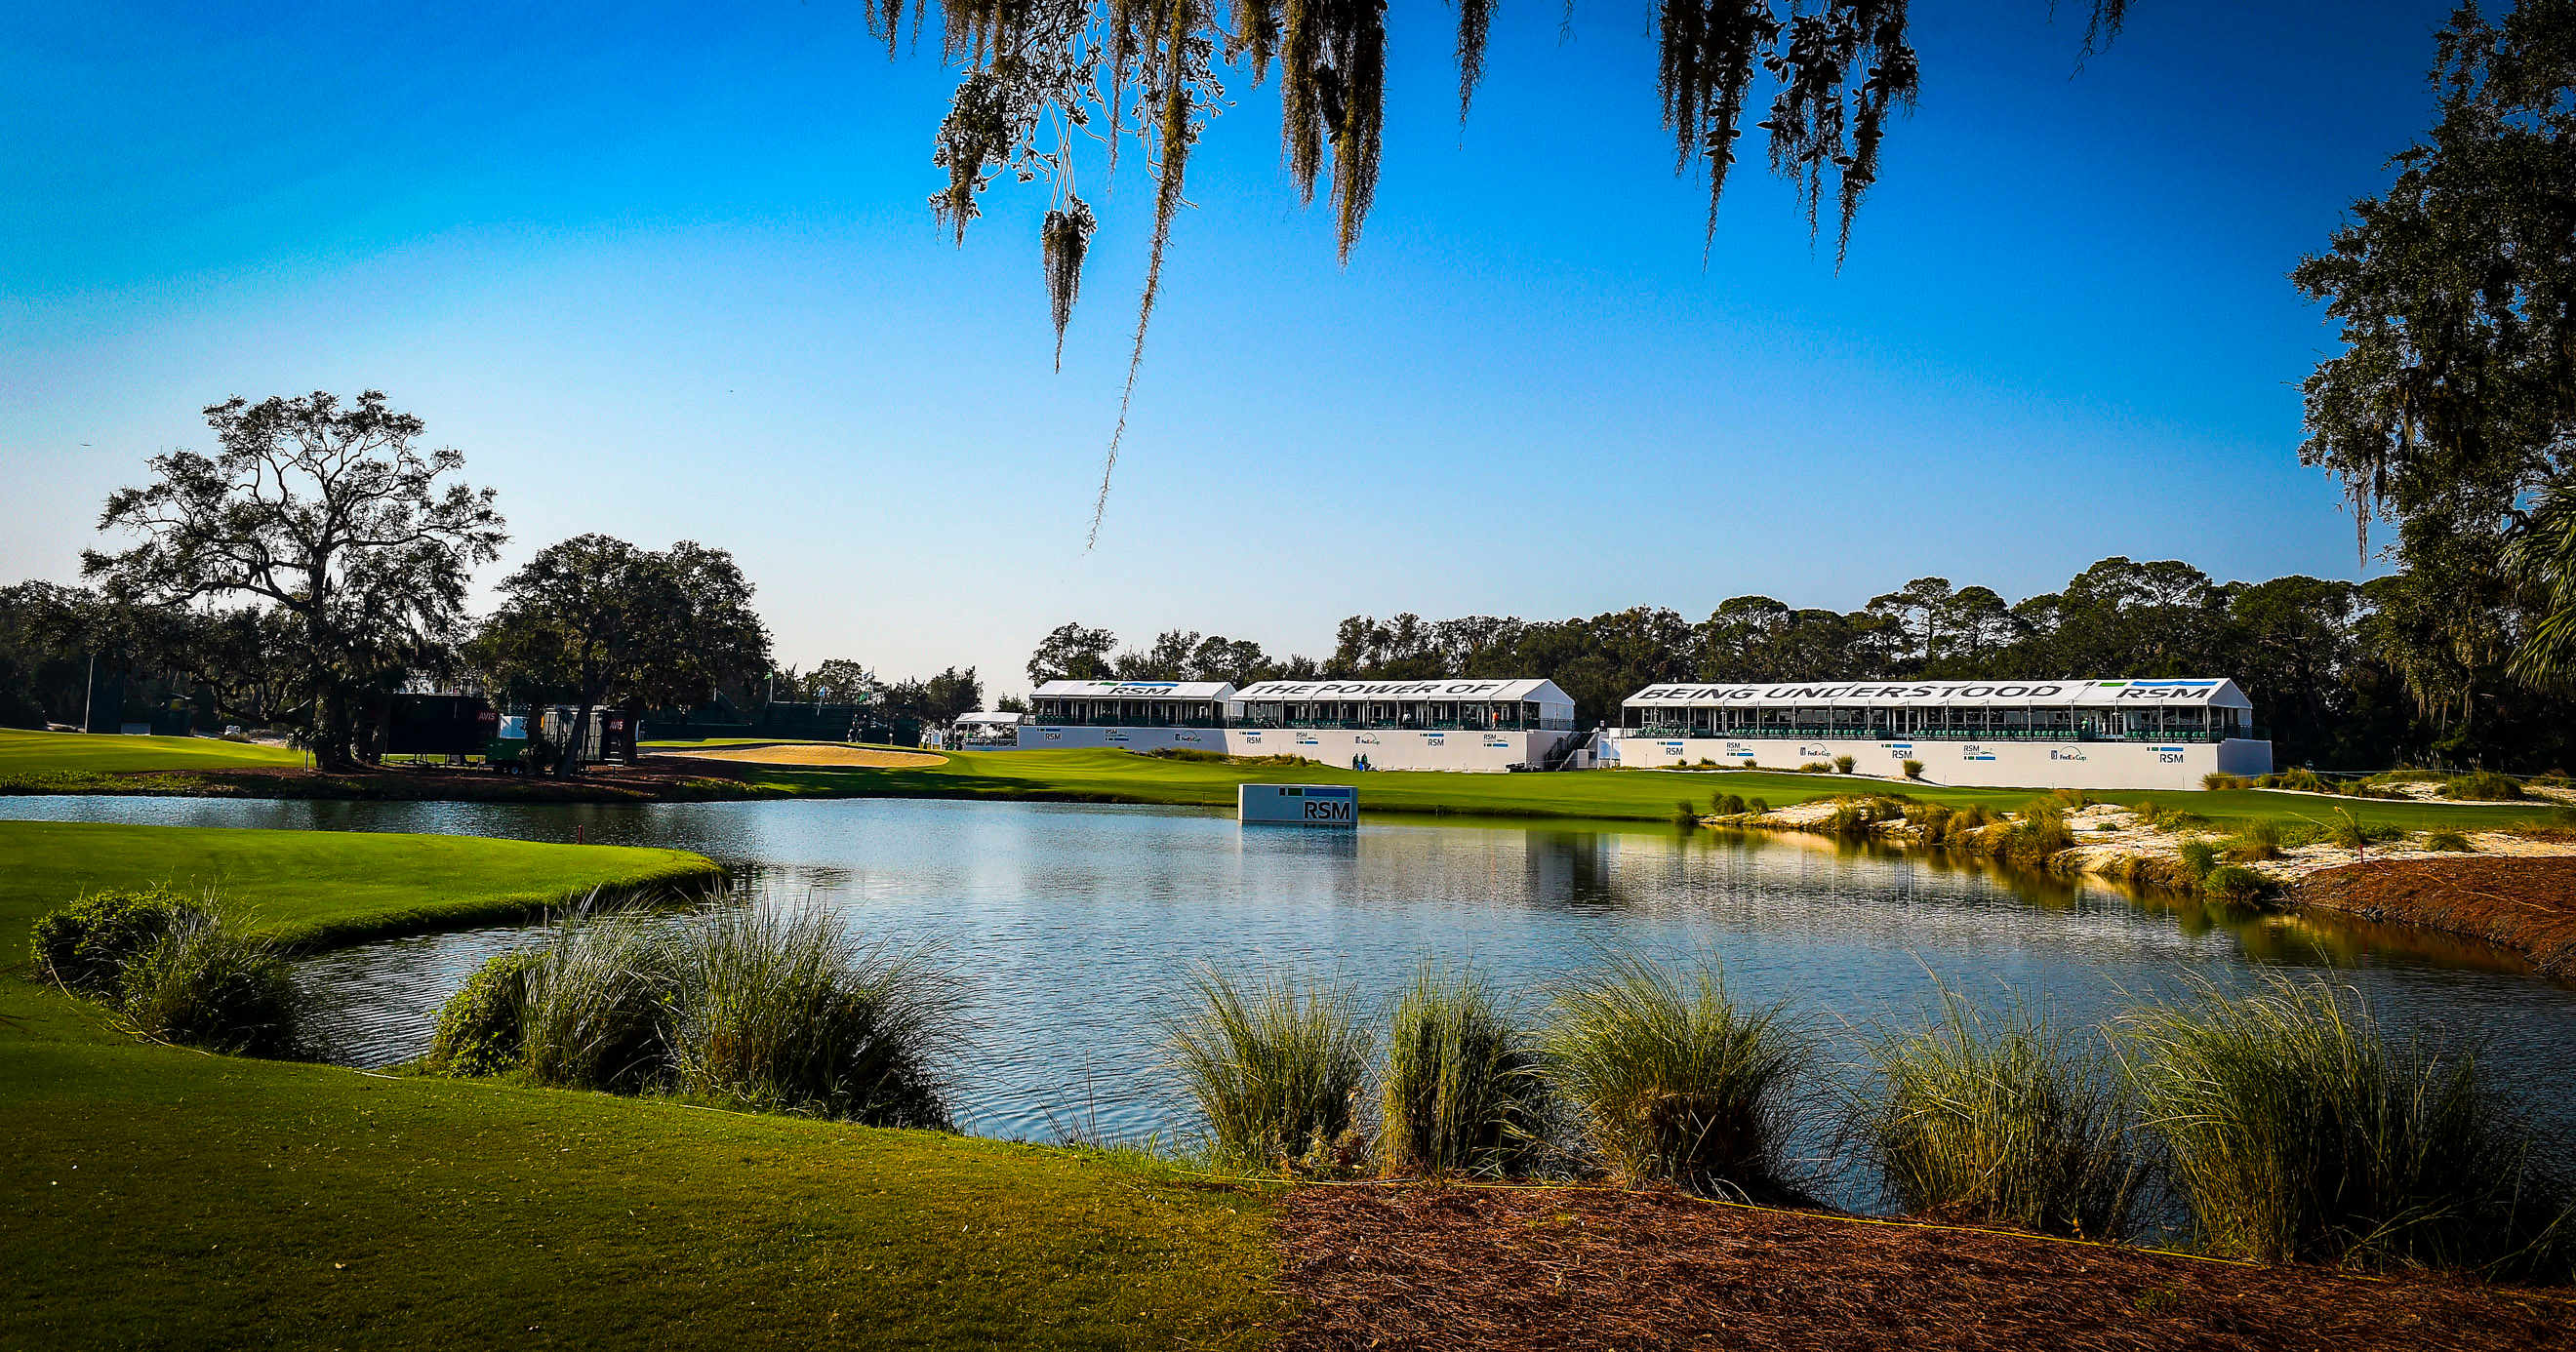
- Venue: Sea Island Golf Club - Seaside Course
- Where: St. Simons Island, Georgia, USA
- Architect: Tom Fazio
- Scorecard: Par 70, 7,157 yards
- Fairways: Bermuda
- Rough: Bermuda, 2 inches
- Greens: Bermuda, running 13 on the stimp
The read: A short par 70 with fast Bermuda greens and only two inches of rough is a scoring week, not a survival week.
What Kind Of Test This Is
The ball-striking side of Seaside is among the gentlest on record. Greens in regulation at 73.6% and approach proximity at 25.5 both rank near the easy end of every course measured, and driving accuracy at 64.3% sits easier than average too. Bogey-or-worse at 14.3% confirms it: trouble is available but it is not hunting anyone down.
The putting surfaces are where the course bites. Putts made inside 10 feet at 74.5% and outside 10 feet at 12.9% both rank among the hardest on tour, which is what 13 on the stimp will do in November wind. The penalty for missing a green, 0.78, is harder than average, while scrambling at 56.2% is ordinary, so the cost of a miss shows up in the recovery putt more than the recovery chip.
One caveat worth holding onto: these percentiles are averaged over 2024-2025 and cover only two runnings. The direction is clear enough, but the precision is not.
The read: Easy to hit, hard to hole out on, so lean toward players whose edge is on the greens rather than in the ball-striking columns.
The Holes
It is a par 70 built from four par 3s, twelve par 4s and two par 5s, which is a heavy par-4 diet by any standard. Those par 4s run from 371 to 480 yards and average 432, with the bulk of them sitting between 360 and 450. The par 3s average 206 yards, long enough to matter at a venue this short overall.
The hardest holes are not long holes. The 446-yard 14th plays 0.122 over par, the 214-yard 3rd plays 0.1 over and the 429-yard 4th plays 0.078 over. None of that is brutal in absolute terms.
Scoring concentrates on the par 5s. The 565-yard 15th gives up 0.596 under par, comfortably the softest hole on the card, with the 581-yard 7th at 0.234 under. The 371-yard 8th at 0.176 under rounds out the obvious birdie stretch.
The read: With only two par 5s and both of them soft, converting at the 7th and 15th is close to mandatory.
Where Strokes Are Won And Lost
Start off the tee, because the finding there is a negative one. Driving distance tracked scoring at 0.014 here against 0.119 tour-wide, a gap of -0.105, the largest move of any statistic in the set. Adjusted off-the-tee strokes gained also mattered less than usual, a gap of -0.066. Accuracy went the other way: adjusted driving accuracy came in at 0.154 against 0.089 tour-wide, a gap of +0.065.
Approach work splits by range. Proximity from 150 to 175 yards carried a gap of +0.07, the second largest positive in the brief, while rough proximity actually moved negative, a gap of -0.077. With fairways this findable and rough at two inches, the approach that mattered was the one played from short grass at mid-iron range.
Around the green, scrambling proximity tracked scoring less closely than at a typical event, a gap of -0.07, which fits a venue where scrambling itself sits at tour average. Proximity from 50 to 75 yards moved the other way, a gap of +0.052. The short-side wedge game travelled better here than the recovery chip.
Putting is the clearest signal. Inside five feet posted a gap of +0.077, the biggest positive in the set, with five to ten feet at +0.054 and adjusted putts gained at +0.046. Birdie-or-better rate mattered less than usual, a gap of -0.045, while bogey-or-worse mattered more, at +0.047. These are correlations drawn from eleven runnings of roughly 114 to 139 players, so they are better supported than the two-year difficulty figures, but they describe what travelled with a good week rather than what the course demands.
The read: Short-putt reliability and mid-iron proximity are the two levers worth paying for, and distance off the tee is not.
Courses It Resembles
The closest match by measured profile is next door: the Plantation Course at Sea Island, 96.0% similar at par 72 and 7,060 yards. The Abaco Club on Winding Bay follows at 89.2%, then The Landings Golf & Athletic Club Deer Creek at 86.2%. Most of the comparable venues play to a higher par than Seaside does.
Sedgefield Country Club at 84.5% is the most useful read-across for a par 70 of similar length, 7,131 yards, and RTJ Trail Grand National at 82.1% rounds out the group. The common thread is modest length and a premium on holing out rather than overpowering anything.
The read: Course-fit models built off Sedgefield and the Plantation Course should carry straight into this week.
What It Took To Win
Ten champions split evenly: putting carried five of them, approach the other five. Nothing in the record suggests a driver-led win is the path here.
Sami Valimaki went to -23 in 2025 on the back of 1.695 putting, and Ludvig Aberg's -29 in 2023 paired 2.138 putting with 1.628 off the tee, the only winner in the group with a driving number that large. Adam Svensson gained 3.053 putting in 2022. On the approach side, Talor Gooch posted 2.093 in 2021 despite losing strokes off the tee at -0.176, and Tyler Duncan and Austin Cook both cleared 1.5.
Maverick McNealy's 2024 win at -16 is the tidiest template, 1.257 approach alongside 1.23 putting and positive marks in all four areas. The counter-case is Mackenzie Hughes in 2016, who lost 0.611 on approach and still won on 2.054 putting and 1.574 around the green. Winning totals have ranged from -16 to -29, so the number required moves with conditions.
The read: Build around a flat-stick week or an elite iron week, and treat anything under -19 as a soft-conditions outcome rather than the baseline.