
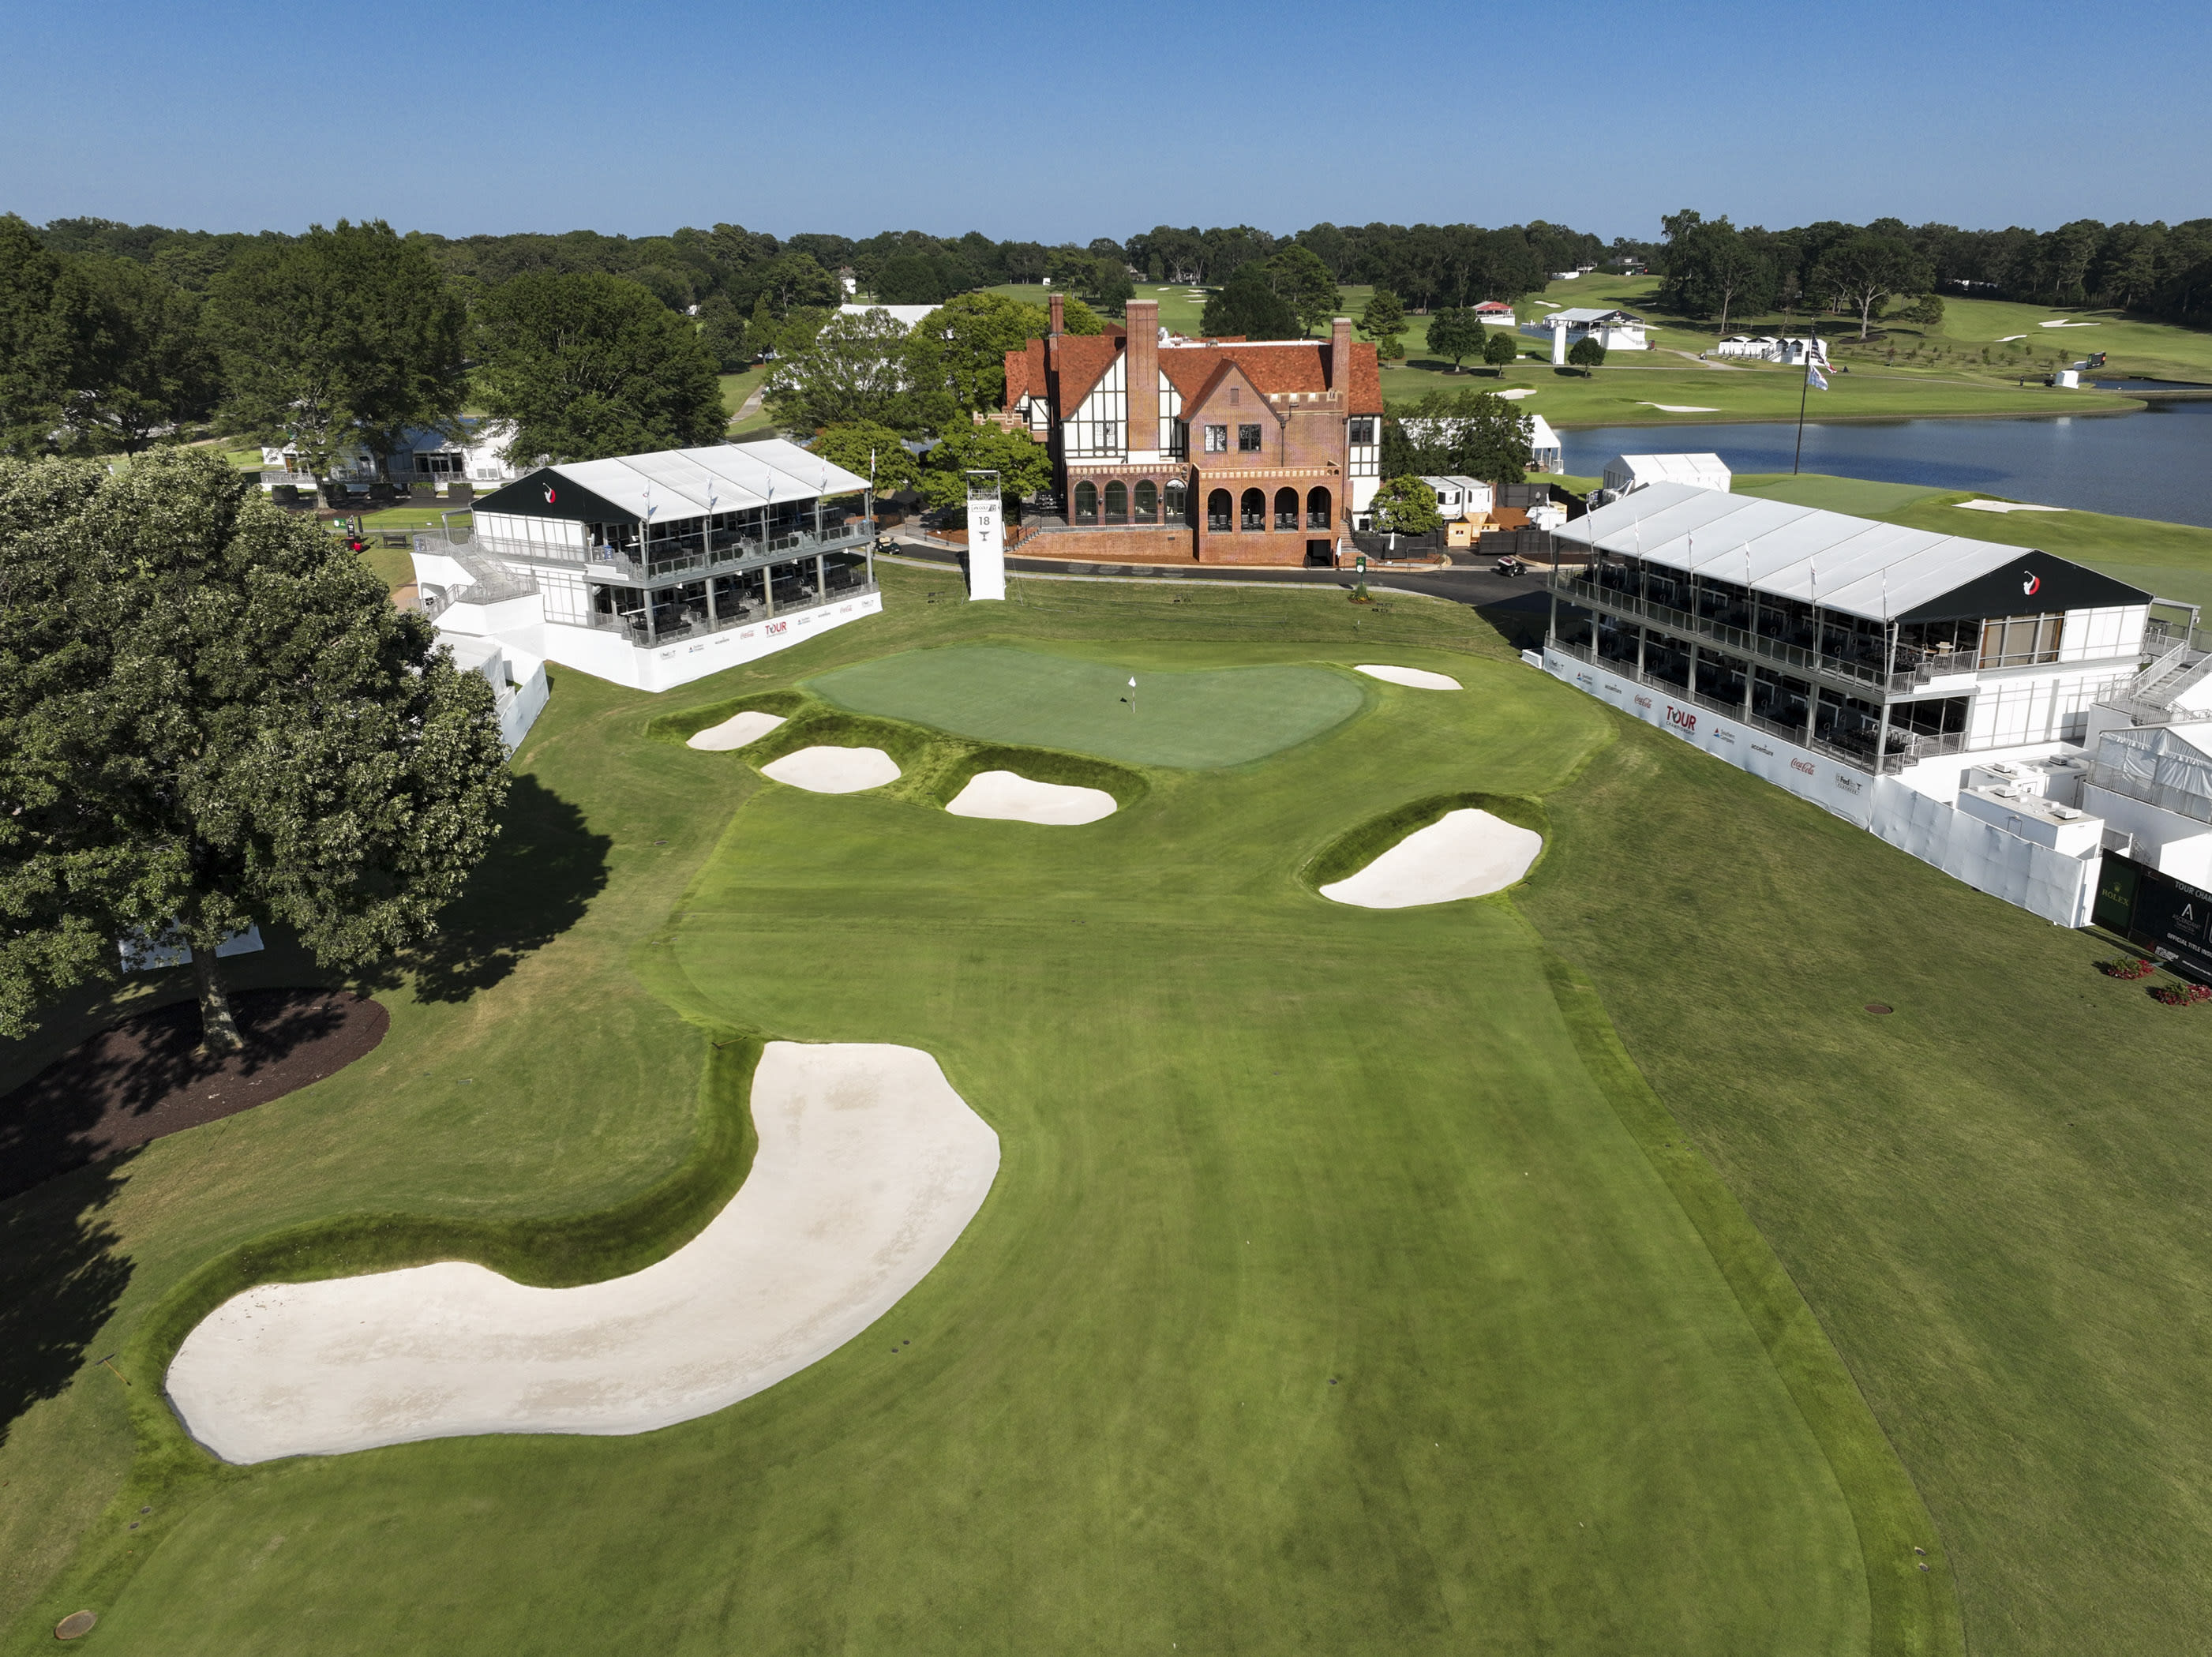
The Card
- Venue: East Lake Golf Club
- Where: Atlanta, Georgia, USA
- Architect: Tom Bendelow
- Scorecard: Par 70, 7,440 yards
- Fairways: Zoysia
- Rough: Bermuda, 3.5 inches
- Greens: Bermuda, running 12 on the stimp
Thirty players, no cut, and a card that has been in place since 2014 in this configuration. The tour also ran a par 71 setup at 7,490 yards in 2024, so the record book here is split across two versions of the same property. This week returns to the par 70, 7,440-yard card.
The read: A 30-man field with no cut means every roster spot is a scoring decision, not a survival one.
What Kind Of Test This Is
The difficulty profile, averaged over 2024-2025, describes a course that gives up scores. Bogey-or-worse rate sat at 12.6% (172nd hardest of 190), scrambling at 64.6% (175th) and birdie-or-better rate at 26.1% (175th). The putting numbers are the extreme: players made 90.5% from inside 10 feet, the easiest mark of any course on record, and 20.2% from outside 10 feet, near the bottom as well.
The one place it bites is off the line. The penalty for missing the fairway registered 0.40, 54th hardest of 190, which is meaningful with 3.5 inches of bermuda rough. Everything else clusters around tour average: greens in regulation at 68.4%, approach proximity at 36.2 feet, penalty for missing the green at 0.74.
The read: Price this as a birdie-fest with a mild accuracy tax, not as a grind.
The Holes
Four par 3s, 12 par 4s and two par 5s. The par 3s average 226 yards, long enough that they function as an extra set of approach tests, and the par 4s average 452 with a range from 390 to 530. Seven of the par 4s measure between 360 and 450 yards, which leaves a cluster of genuinely short two-shotters alongside a handful that play like par 4-and-a-half holes.
The scoring is lopsided. Hole 1, a 510-yard par 4, played 0.138 over par, with the 530-yard 14th at 0.130 over and the 465-yard 4th at 0.097 over. Every one of the toughest holes is a long par 4.
The give-backs are the two par 5s. Hole 6 at 525 yards played 0.478 under par and the 585-yard 18th played 0.410 under, with the 415-yard 3rd next at 0.165 under. With only two par 5s on the card, converting both becomes a larger share of the week's scoring than it would be at a par 72.
The read: The tournament is decided on the long par 4s and the two reachable par 5s, and little else moves the needle.
Where Strokes Are Won And Lost
Start with the tee, because the gaps point there. Adjusted off-the-tee strokes gained over the last 12 months tracked scoring here at +0.102 above its tour-wide relationship, and adjusted driving distance over 24 months came in at +0.106 above normal. Combined with the 0.40 penalty for missing the fairway, the picture is a course where getting the ball out there and keeping it in the zoysia travelled with good weeks.
Approach is where the largest single gap sits. Proximity from 150-175 yards, measured on eight-week form, tracked scoring at 0.278 here against 0.056 tour-wide, a gap of +0.223. Proximity from 100-125 yards added +0.106 and greens in regulation +0.110, while 125-150 yards actually ran slightly the other way at -0.104. Adjusted total tee-to-green over nine months carried a +0.137 gap, the broadest confirmation of the pattern.
The short game is the finding most people will miss. Scrambling form over 24 months tracked scoring at 0.002 here against 0.174 tour-wide, a gap of -0.173, and adjusted around-the-green form ran -0.105 below its usual relationship. That fits a venue where players got up and down 64.6% of the time.
Putting looks the same way. Adjusted putts gained over 24 months came in 0.137 below its tour-wide figure, three-putt avoidance 0.156 below and five-to-ten-foot putting 0.093 below. That sits awkwardly against the past champions, who have often been carried by the flat stick, and it is worth holding both facts at once: a hot week on 12-stimp bermuda still wins tournaments, but prior putting form has not been the thing that separated the field. These are correlations across seven runnings of roughly 29 players, a thin sample by any standard.
The read: Weight tee-to-green form and mid-iron proximity, and discount scrambling and putting metrics more than the leaderboards would suggest.
Courses It Resembles
The closest measured match is TPC River Highlands at 88.6% similar, another par 70 at 6,844 yards where scoring runs deep. TPC Craig Ranch follows at 86.5% (par 71, 7,385 yards) and Panther Creek Country Club at 86.2% (par 71, 7,258 yards), both venues where the winning number gets well into red figures.
PGA West (Nicklaus) at 85.8% and Sherwood Country Club at 85.0% round out the group, and both play to par 72 at under 7,100 yards. Most of the comparables are shorter than East Lake and play to a higher par, which is the tell: the similarity is in scoring behaviour rather than in dimensions.
The read: Course history from birdie-heavy, low-resistance venues travels here better than history from long par 72s.
What It Took To Win
Winning scores have trended lower over the run of this card. Patrick Cantlay took the 2021 title at -11 and Tiger Woods won at -11 in 2018, while Collin Morikawa reached -22 in 2024 and Tommy Fleetwood posted -18 in 2025. Note that the 2024 edition was played on the par 71, 7,490-yard setup.
The strongest area tally reads putting five, off the tee four, around the green one and approach one. Fleetwood's 2025 win was a putting week (+2.037) with negative marks off the tee and around the green, and Xander Schauffele gained 2.125 putting in 2020. Rory McIlroy's 2016 win ran the other direction: +1.651 off the tee against -0.107 putting.
What almost every champion shares is that the tee shot did not cost them. Viktor Hovland gained 1.204 both off the tee and on approach in 2023, McIlroy gained 1.329 off the tee in 2019, and Morikawa was positive in all four categories in 2024. The winners who leaned on putting were still neutral-to-good with the driver.
The read: Build around drivers and iron players, then accept that the winner will likely be whichever of them holes out best for four days.